 Solidus
Analysis
The Explorer: your own pivot table
The Explorer is a table you build yourself: you choose how to group (rows) and which figures to see (values), and the table calculates itself.
In short
- Levels: how it is grouped (wallet, position, asset class, status).
- Variables: what is measured (value, total return, annualised, minus CPI…).
- Save your favourite set-ups as views.
- On iPhone you get a simplified version with the same views.
1Build the table
On desktop, drag (or tap) fields from the “Fields” panel into “Rows”, “Columns”, “Filters” and “Values”. For example: rows = Wallet, values = Current value and Total return. You can nest levels (Wallet → Position) and expand them.
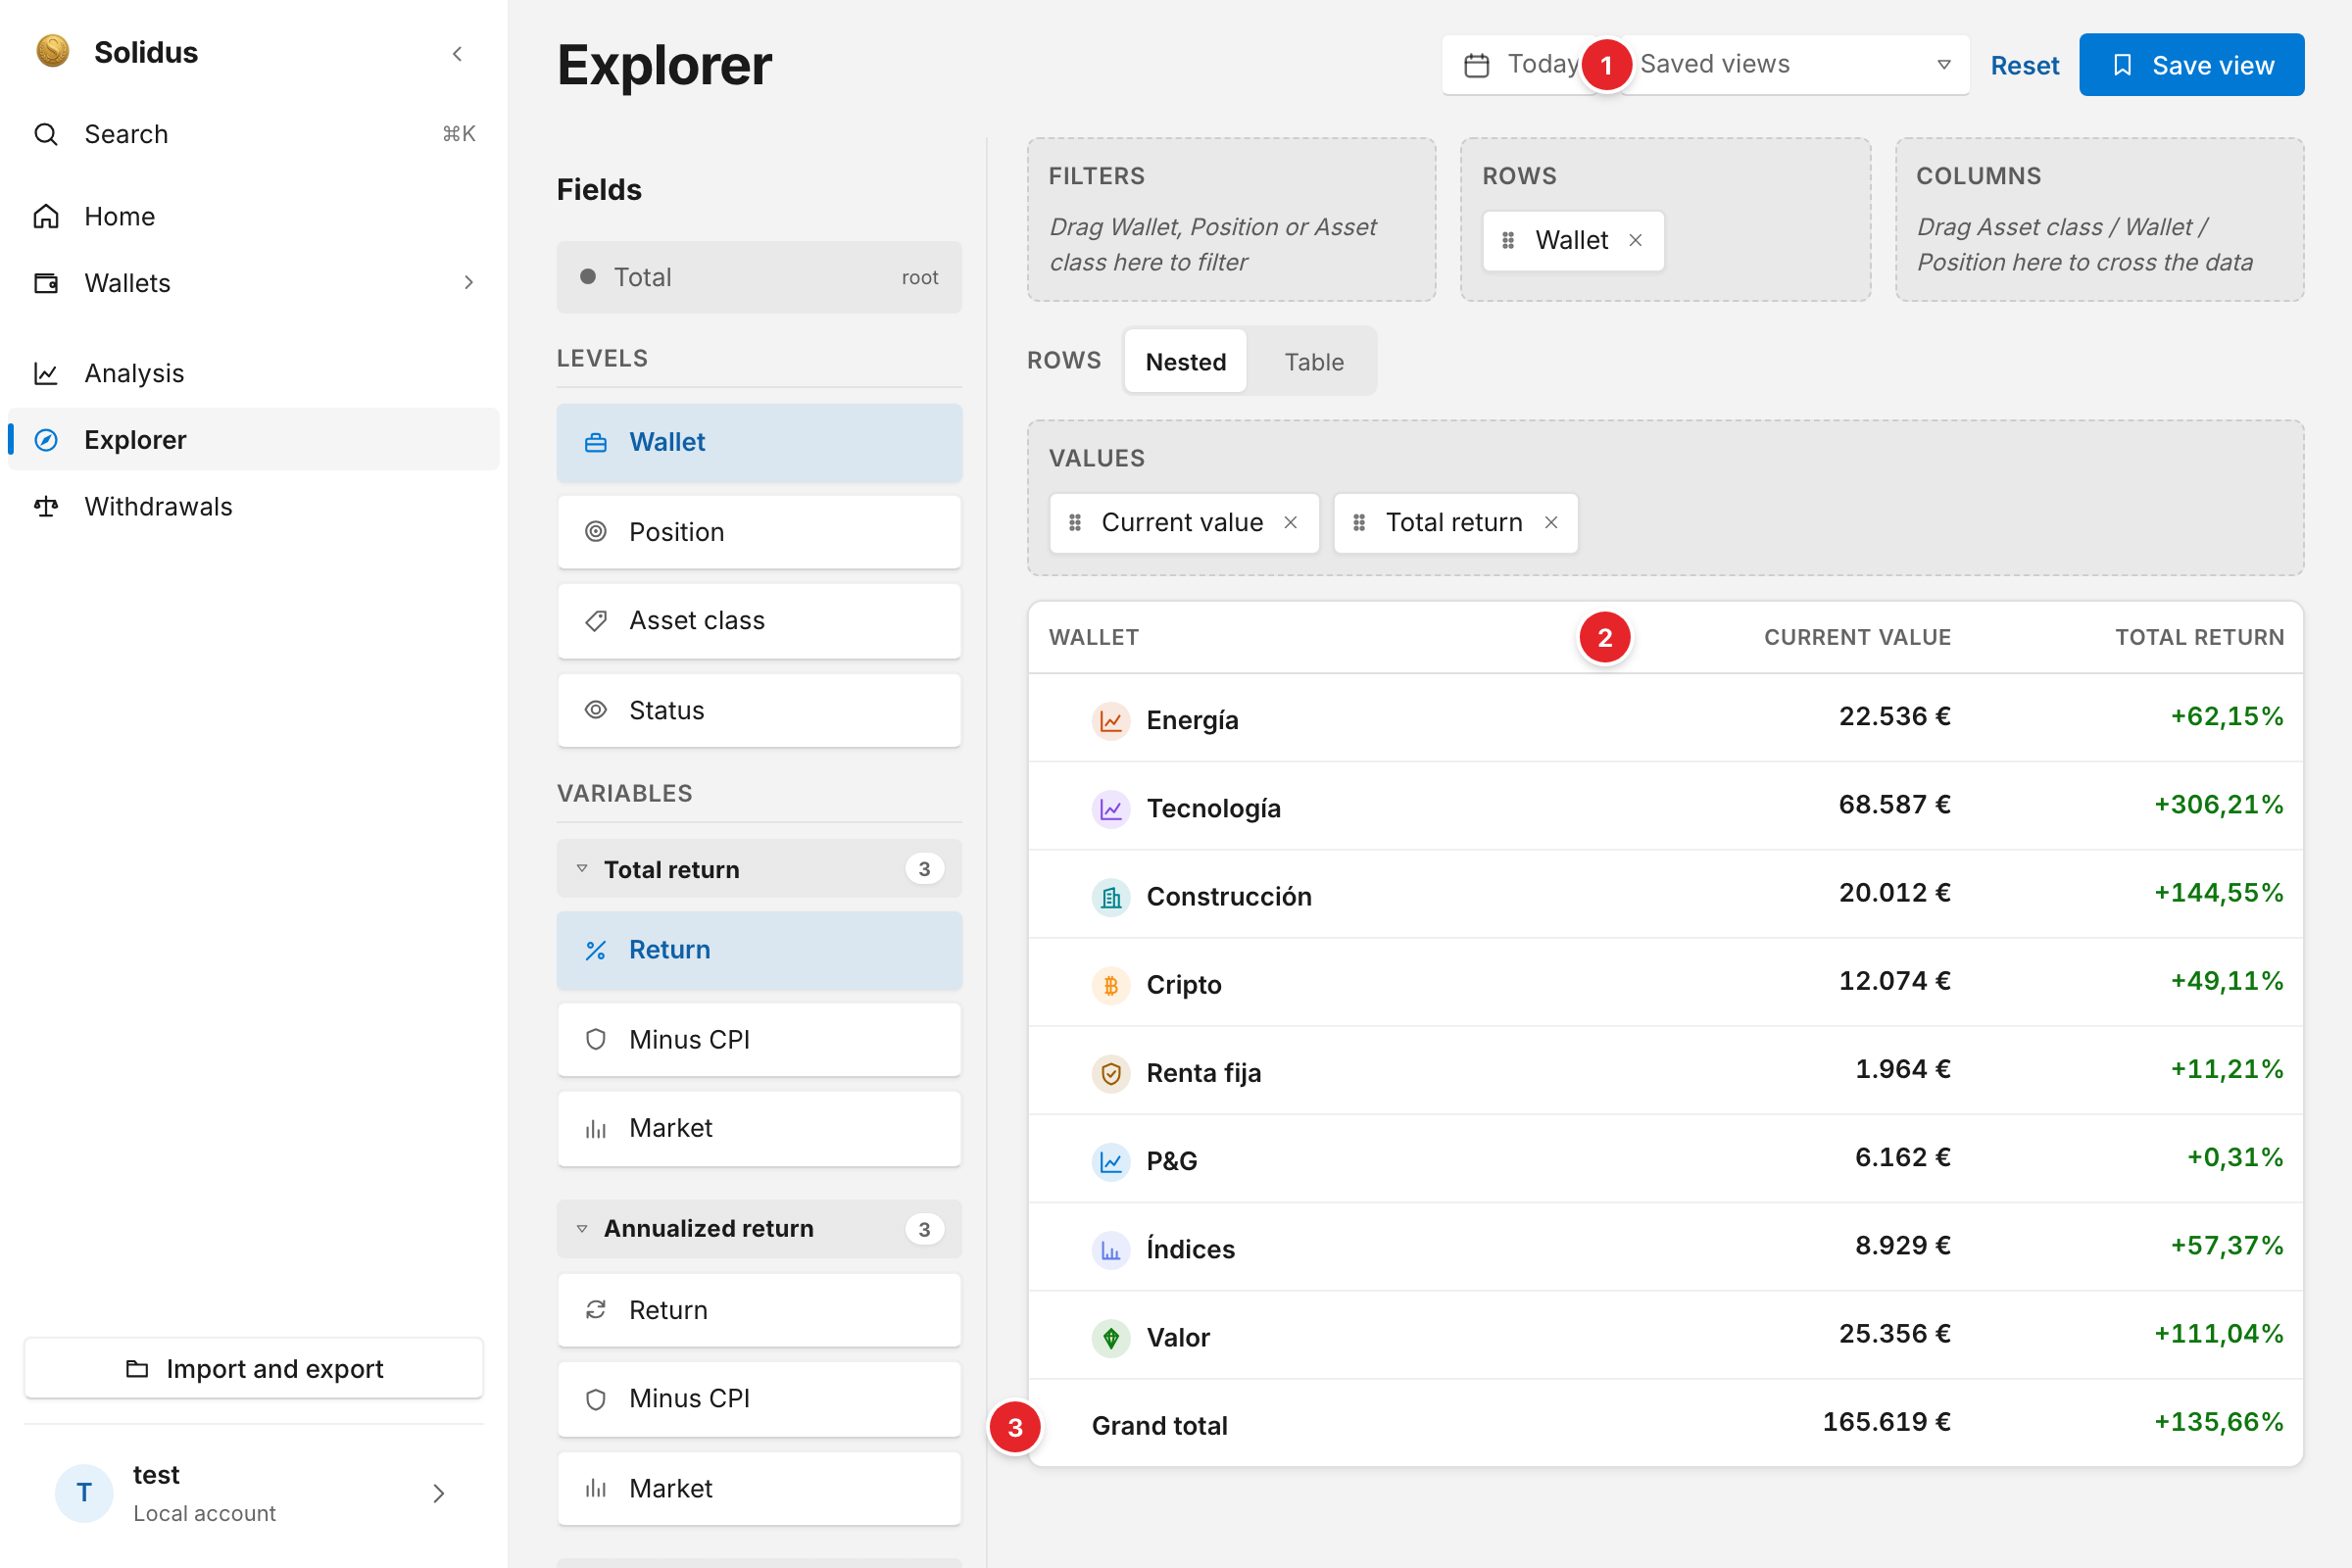
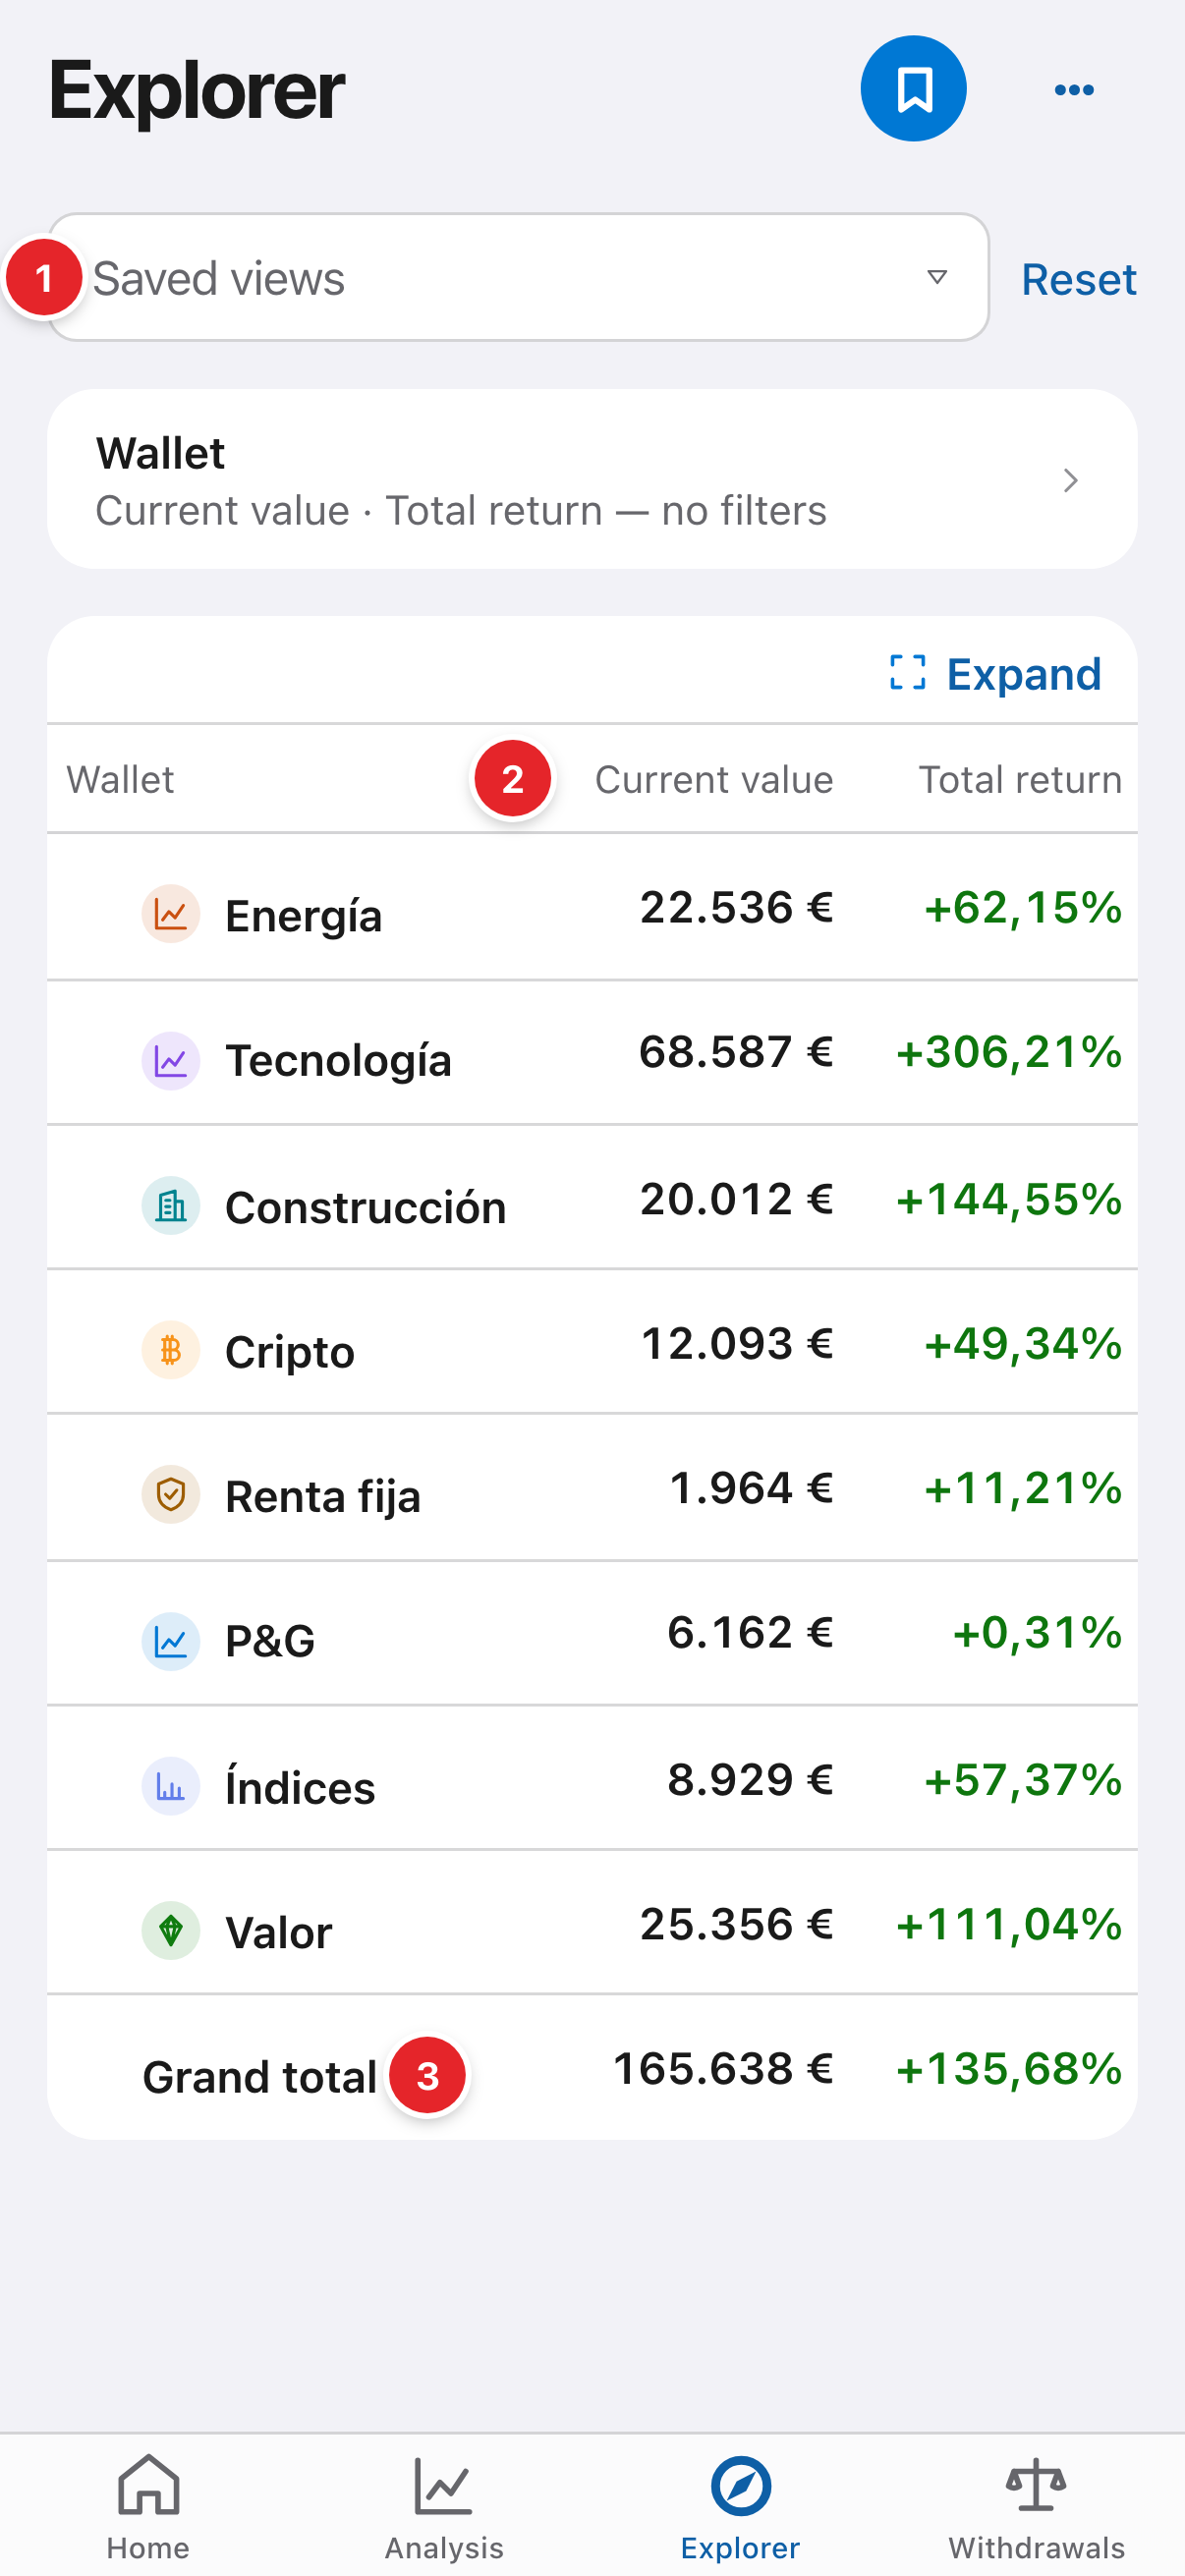
- “Saved views”: bring back a set-up you saved. “Save view” creates a new one.
- The value columns: what you measure on each row.
- “Grand total”: the sum or average of the whole scope.
2Save the view
When the table is useful, press “Save view” and name it. “Reset” goes back to the initial set-up.
Screenshots are of the real app with sample data, not anyone’s own.
Common problems
I can’t see return minus CPI
Turn it on under Settings → “Show inflation data”.
Next step
Withdrawals: what you would pay to take money out → · All guides