 Solidus
Analysis
Analysis · Returns and Sectors
Two tabs to go a step further: which wallets perform and who carries the result, and which sectors you are really invested in.
In short
- Always compare annualised return: cumulative favours older wallets.
- “Where your gain comes from” is in money, not %.
- The sector matrix reveals overlap between funds.
- Sectors come from the data the price source publishes.
Before you start
Annualised return (IRR)
The yearly percentage that reconciles all your buys, sells and dividends with what it is worth today. It accounts for when each euro went in, which makes wallets started in different years comparable.
1The “Returns” tab
On the left, each wallet’s return; on the right, how much money each contributes to the result.
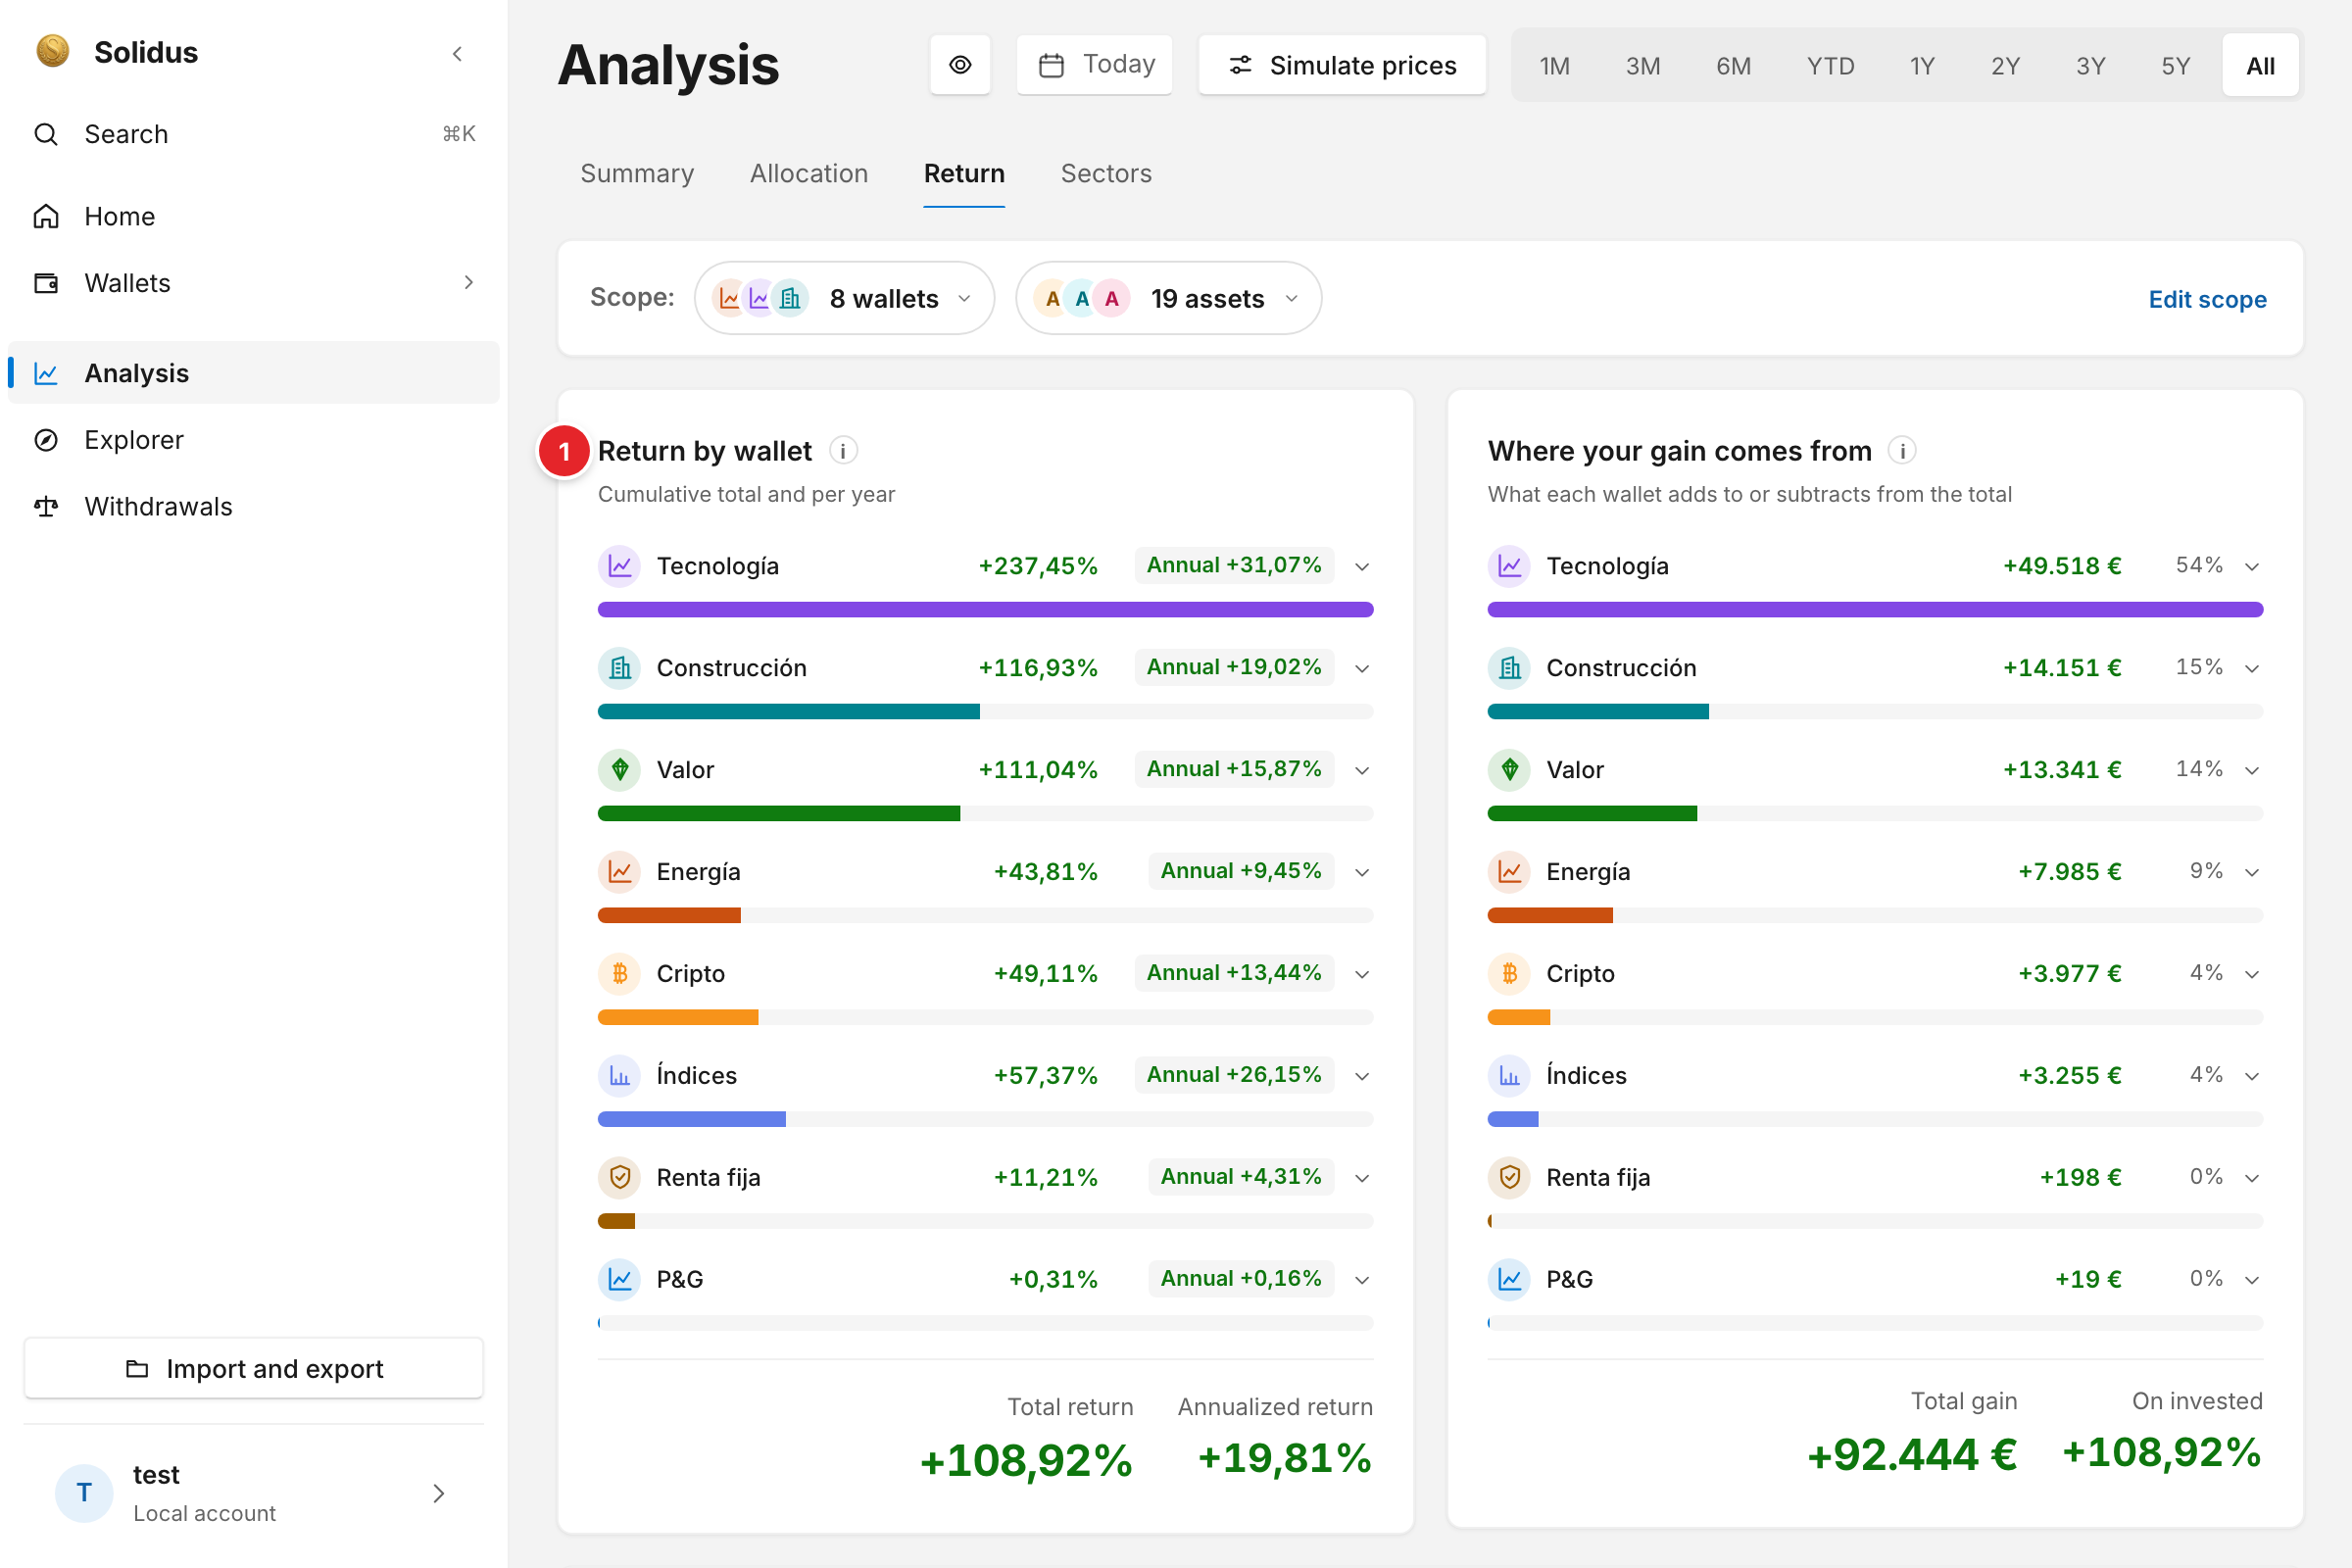
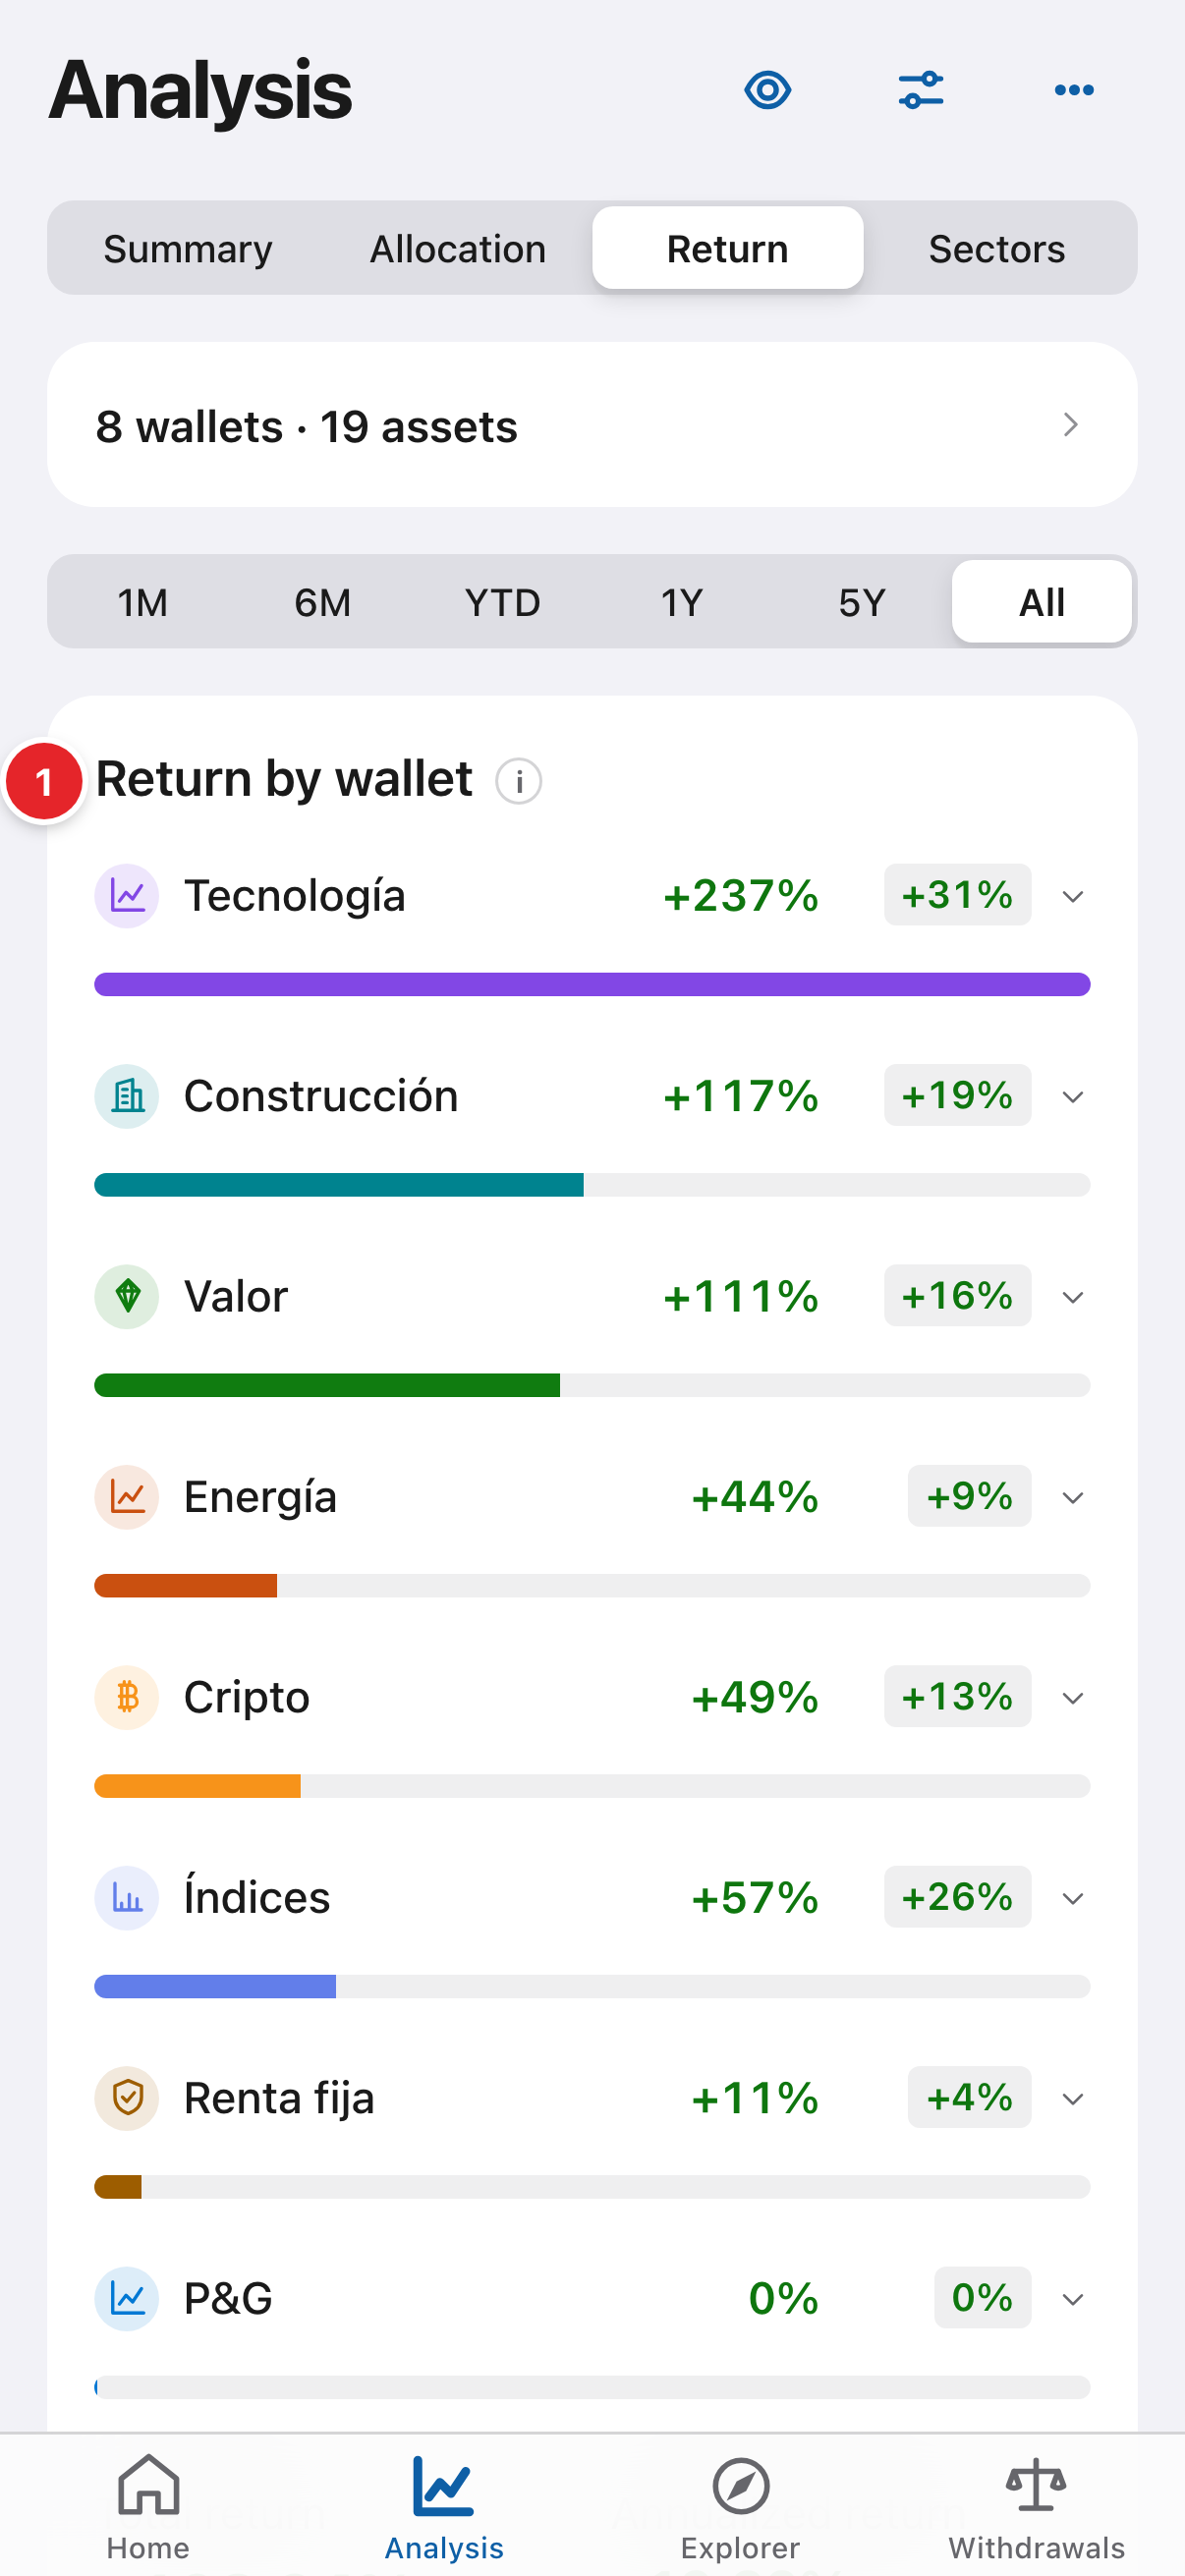
- “Return by wallet”: cumulative gain in % over what you contributed (appreciation, dividends and sales included), with its annualised figure beside it and split by year when expanded. Always compare the annualised one.
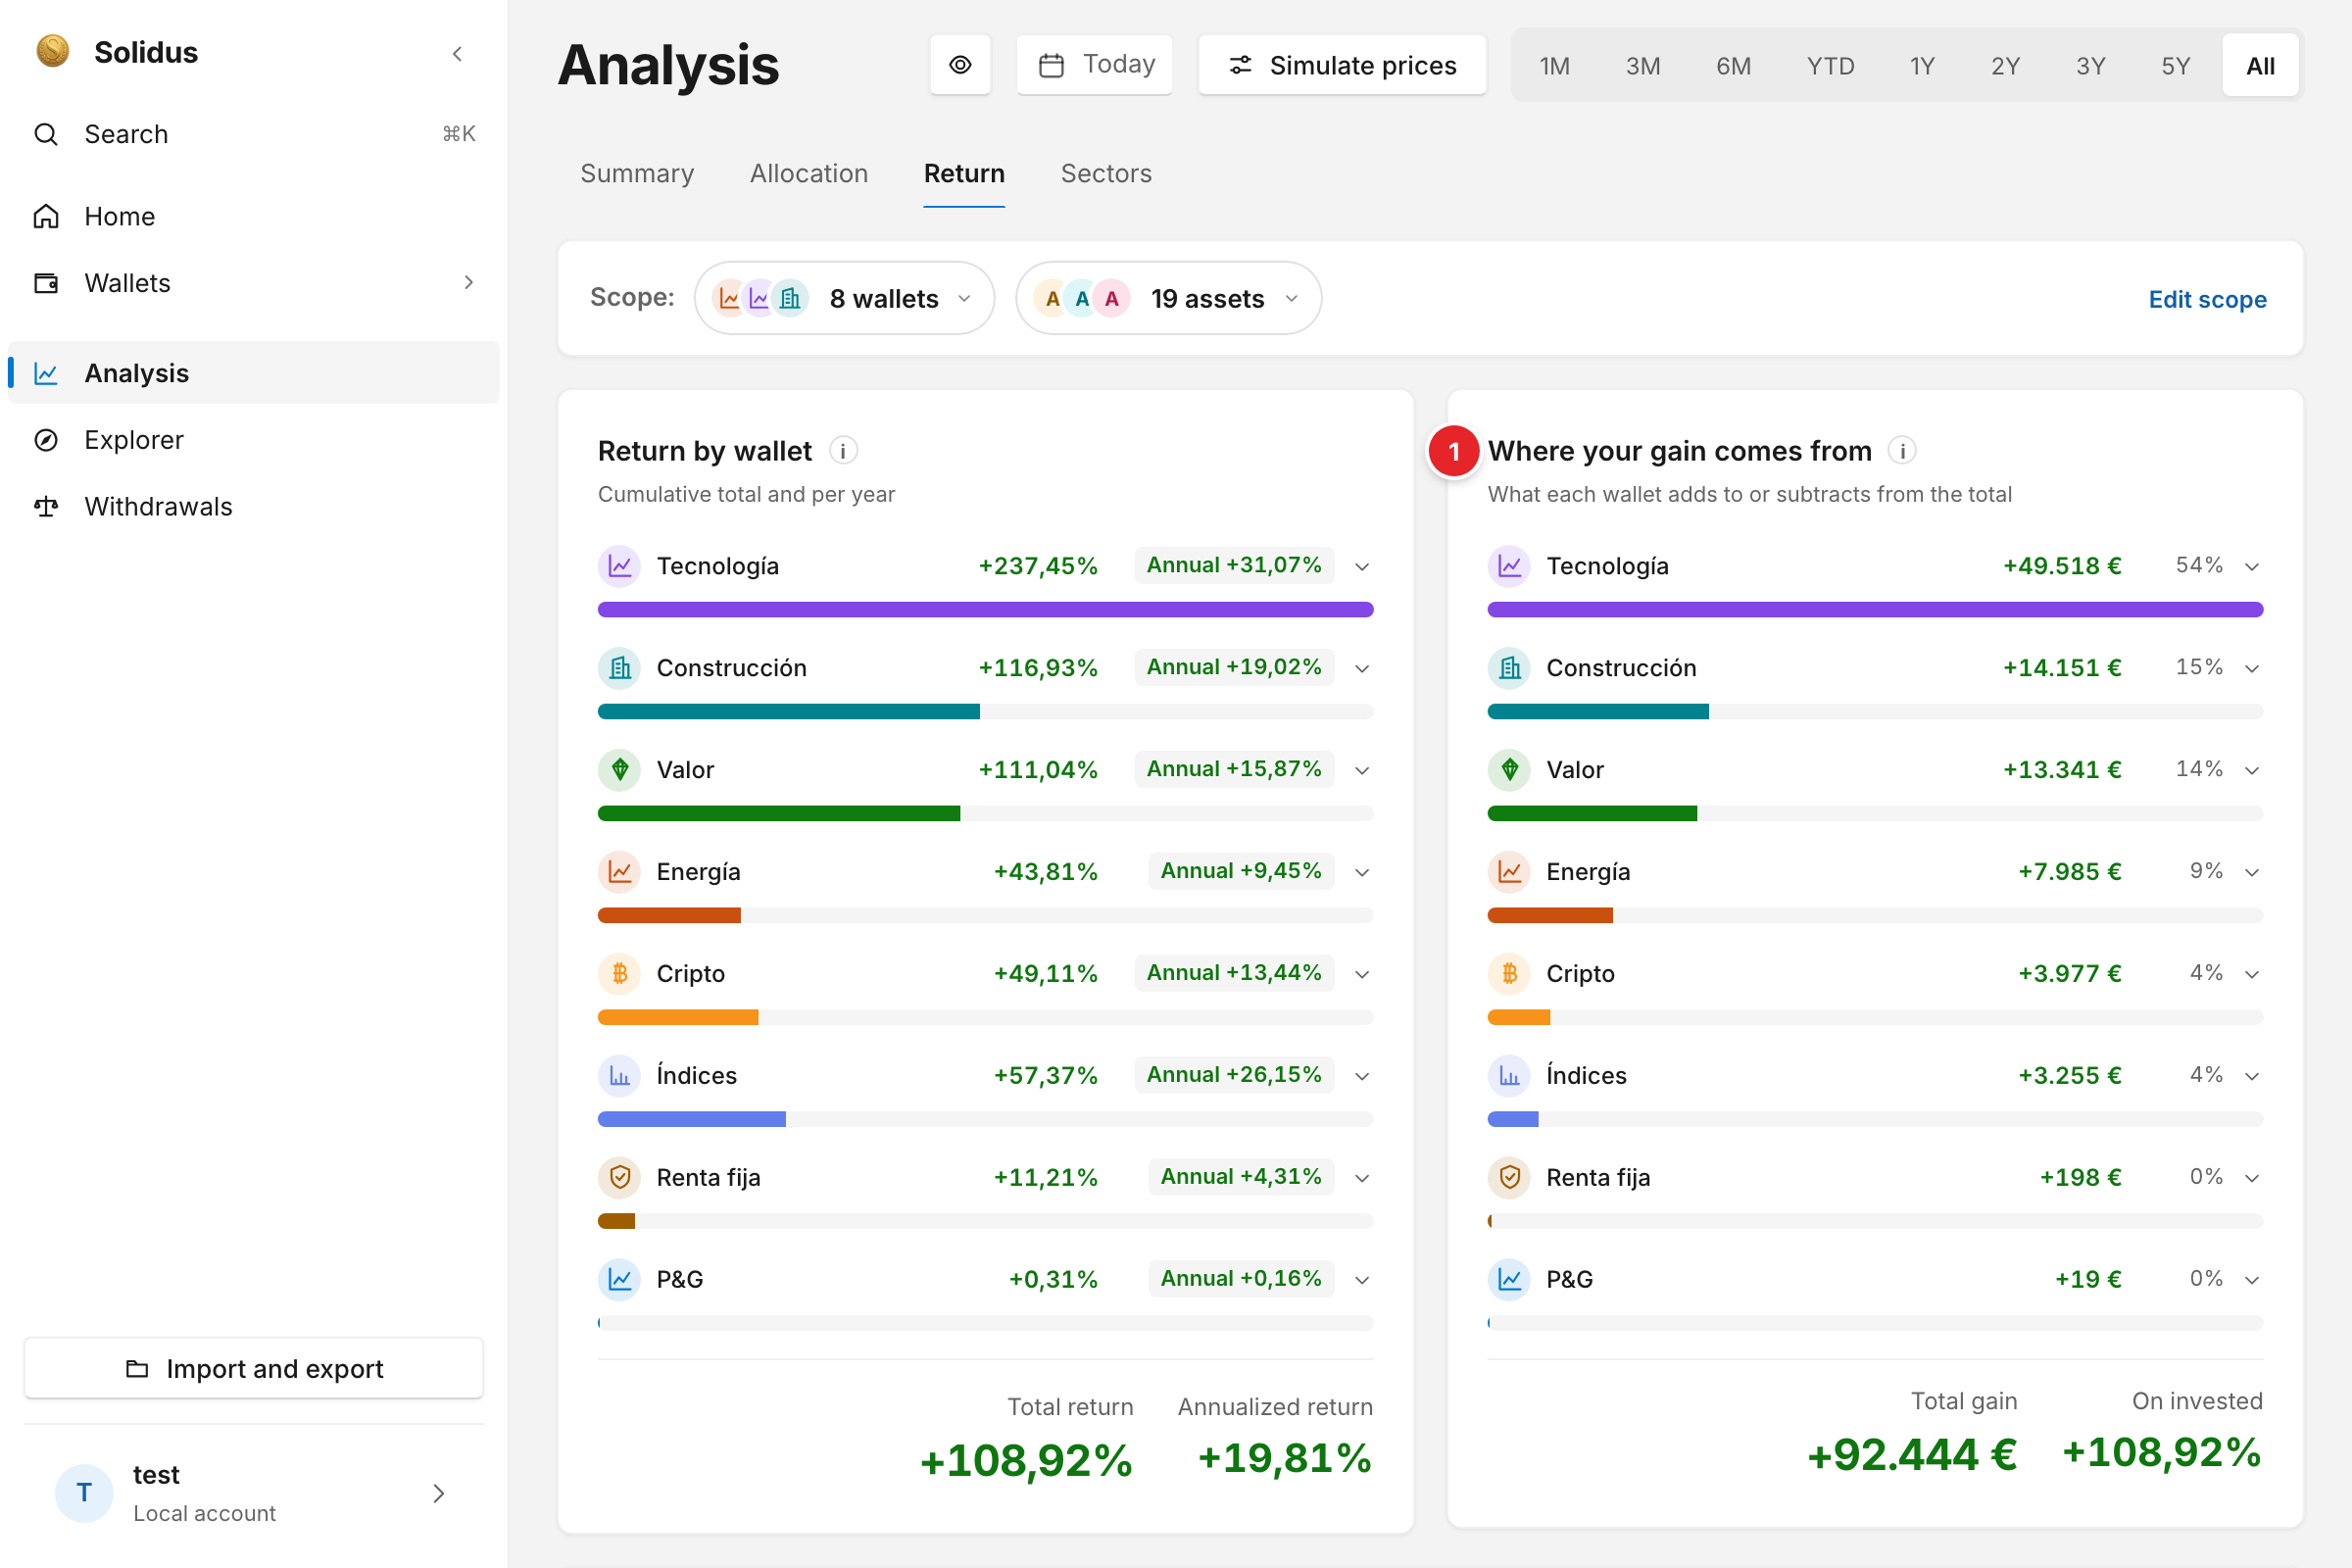
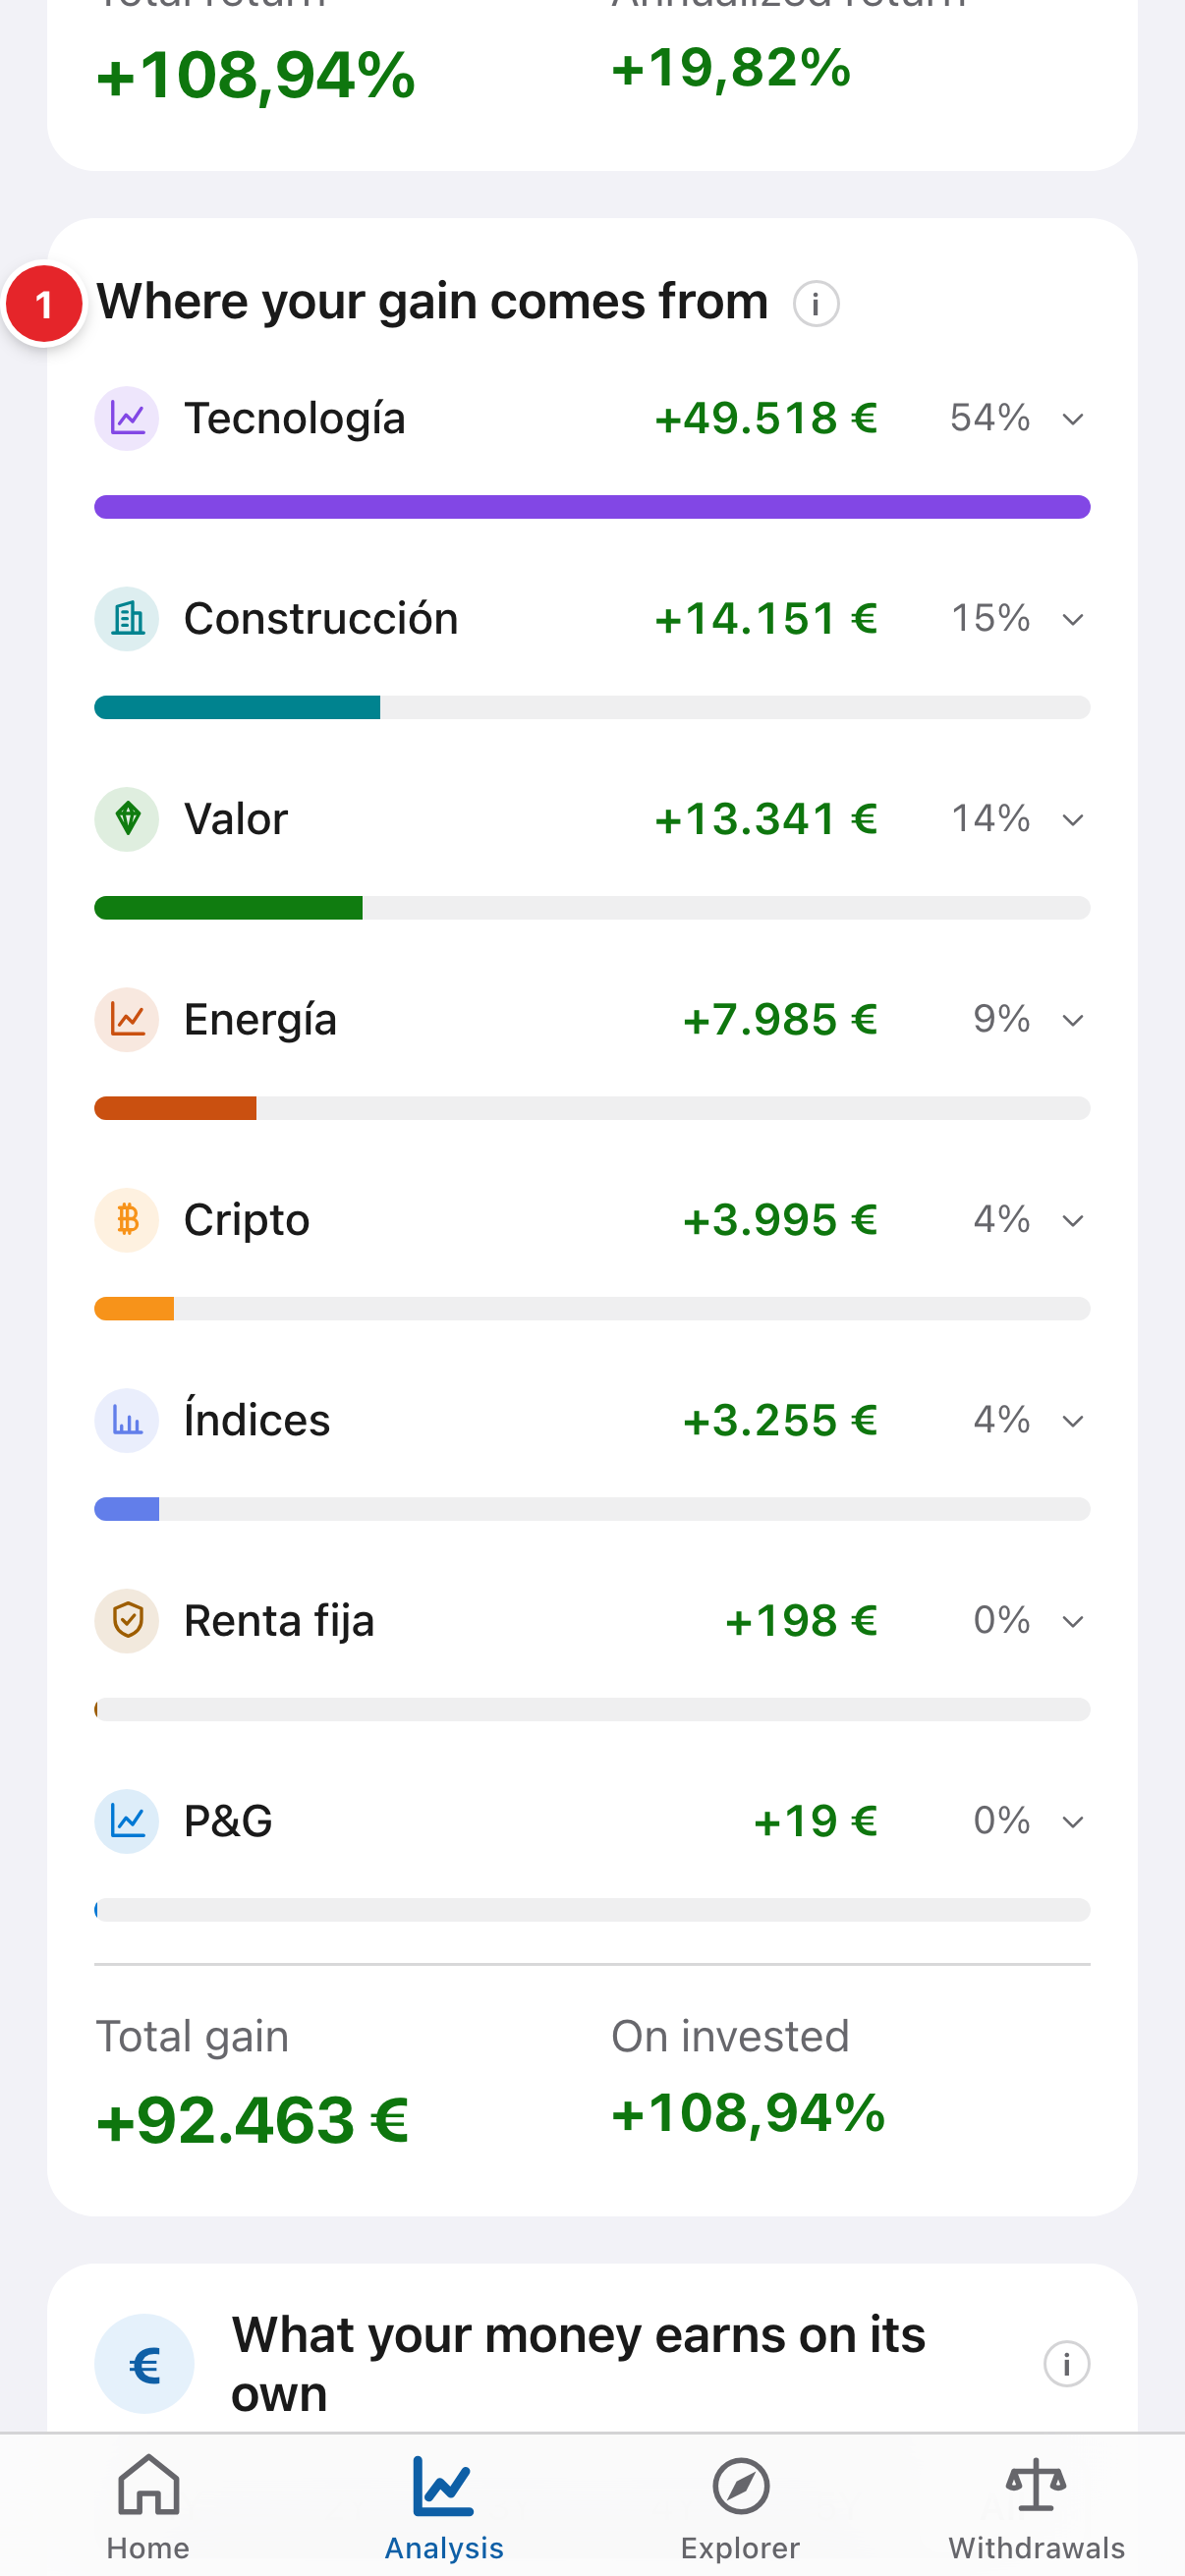
- “Where your gain comes from”: money each wallet adds to the total. To the right of zero it adds, to the left it subtracts. Sometimes almost all of it comes from a single wallet.
2The “Sectors” tab
The matrix crosses your funds and stocks with the sectors they invest in. Each column is an asset; each row, a sector. The last column is your real exposure per sector, adding everything up.
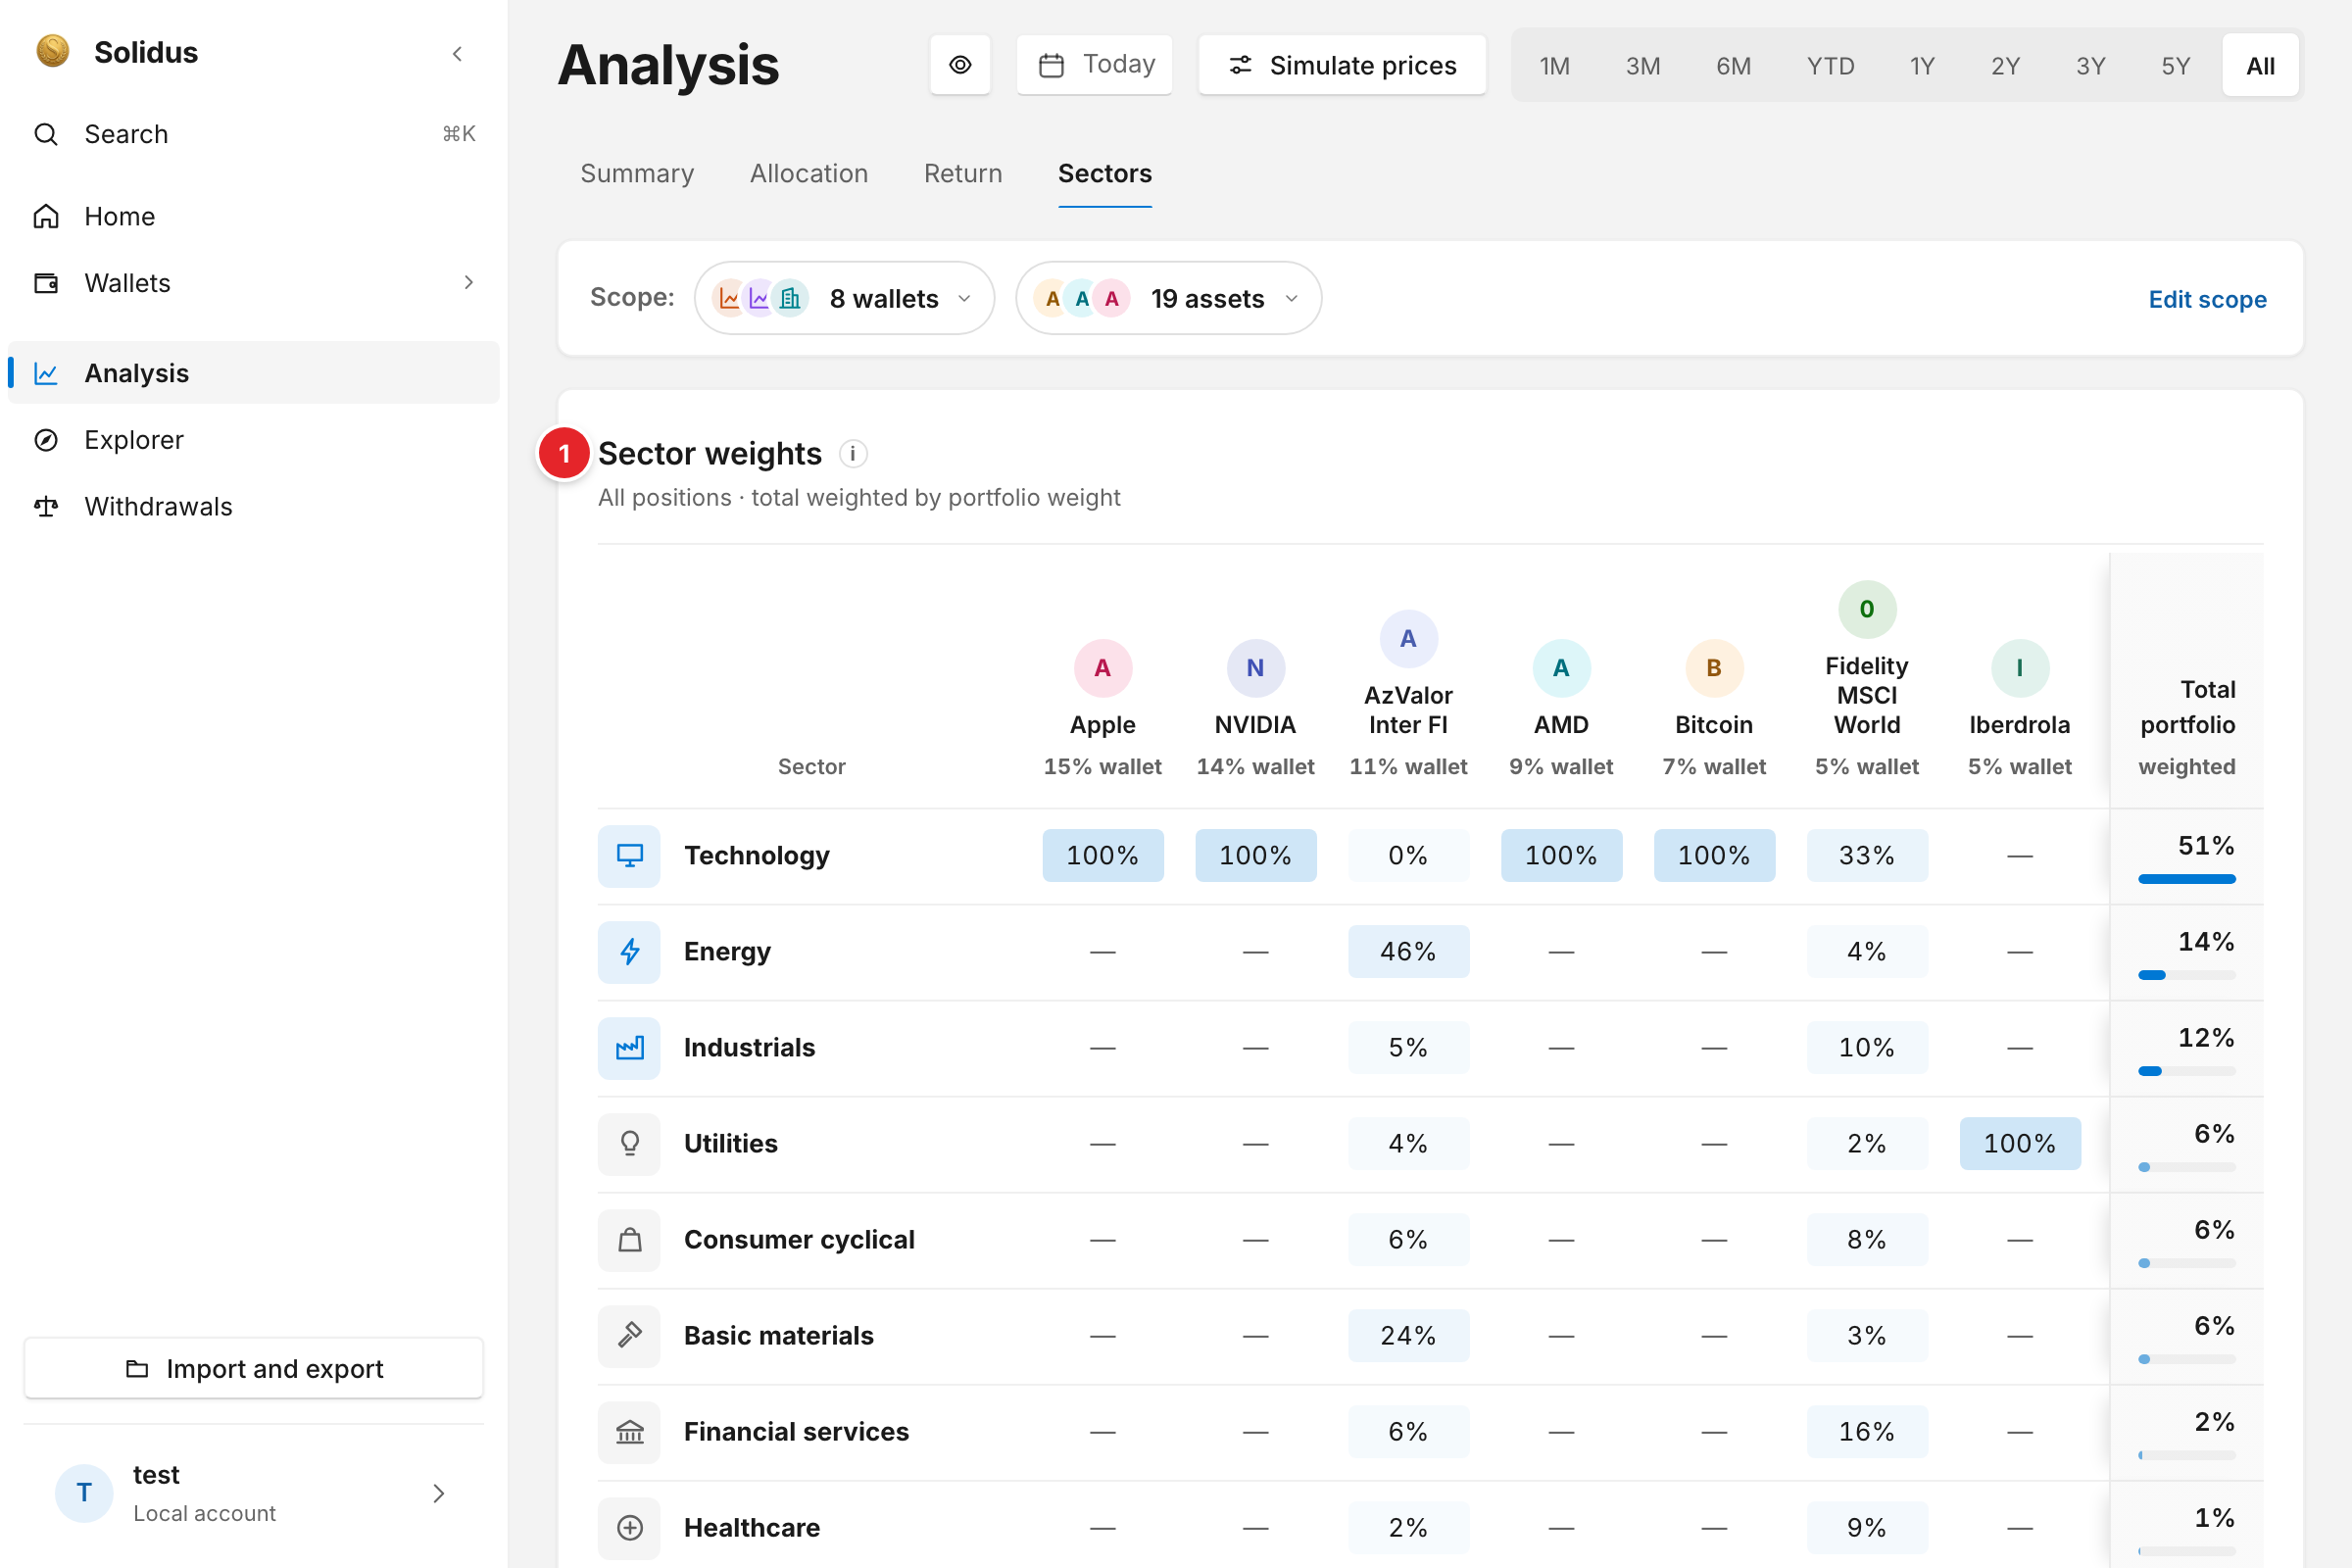
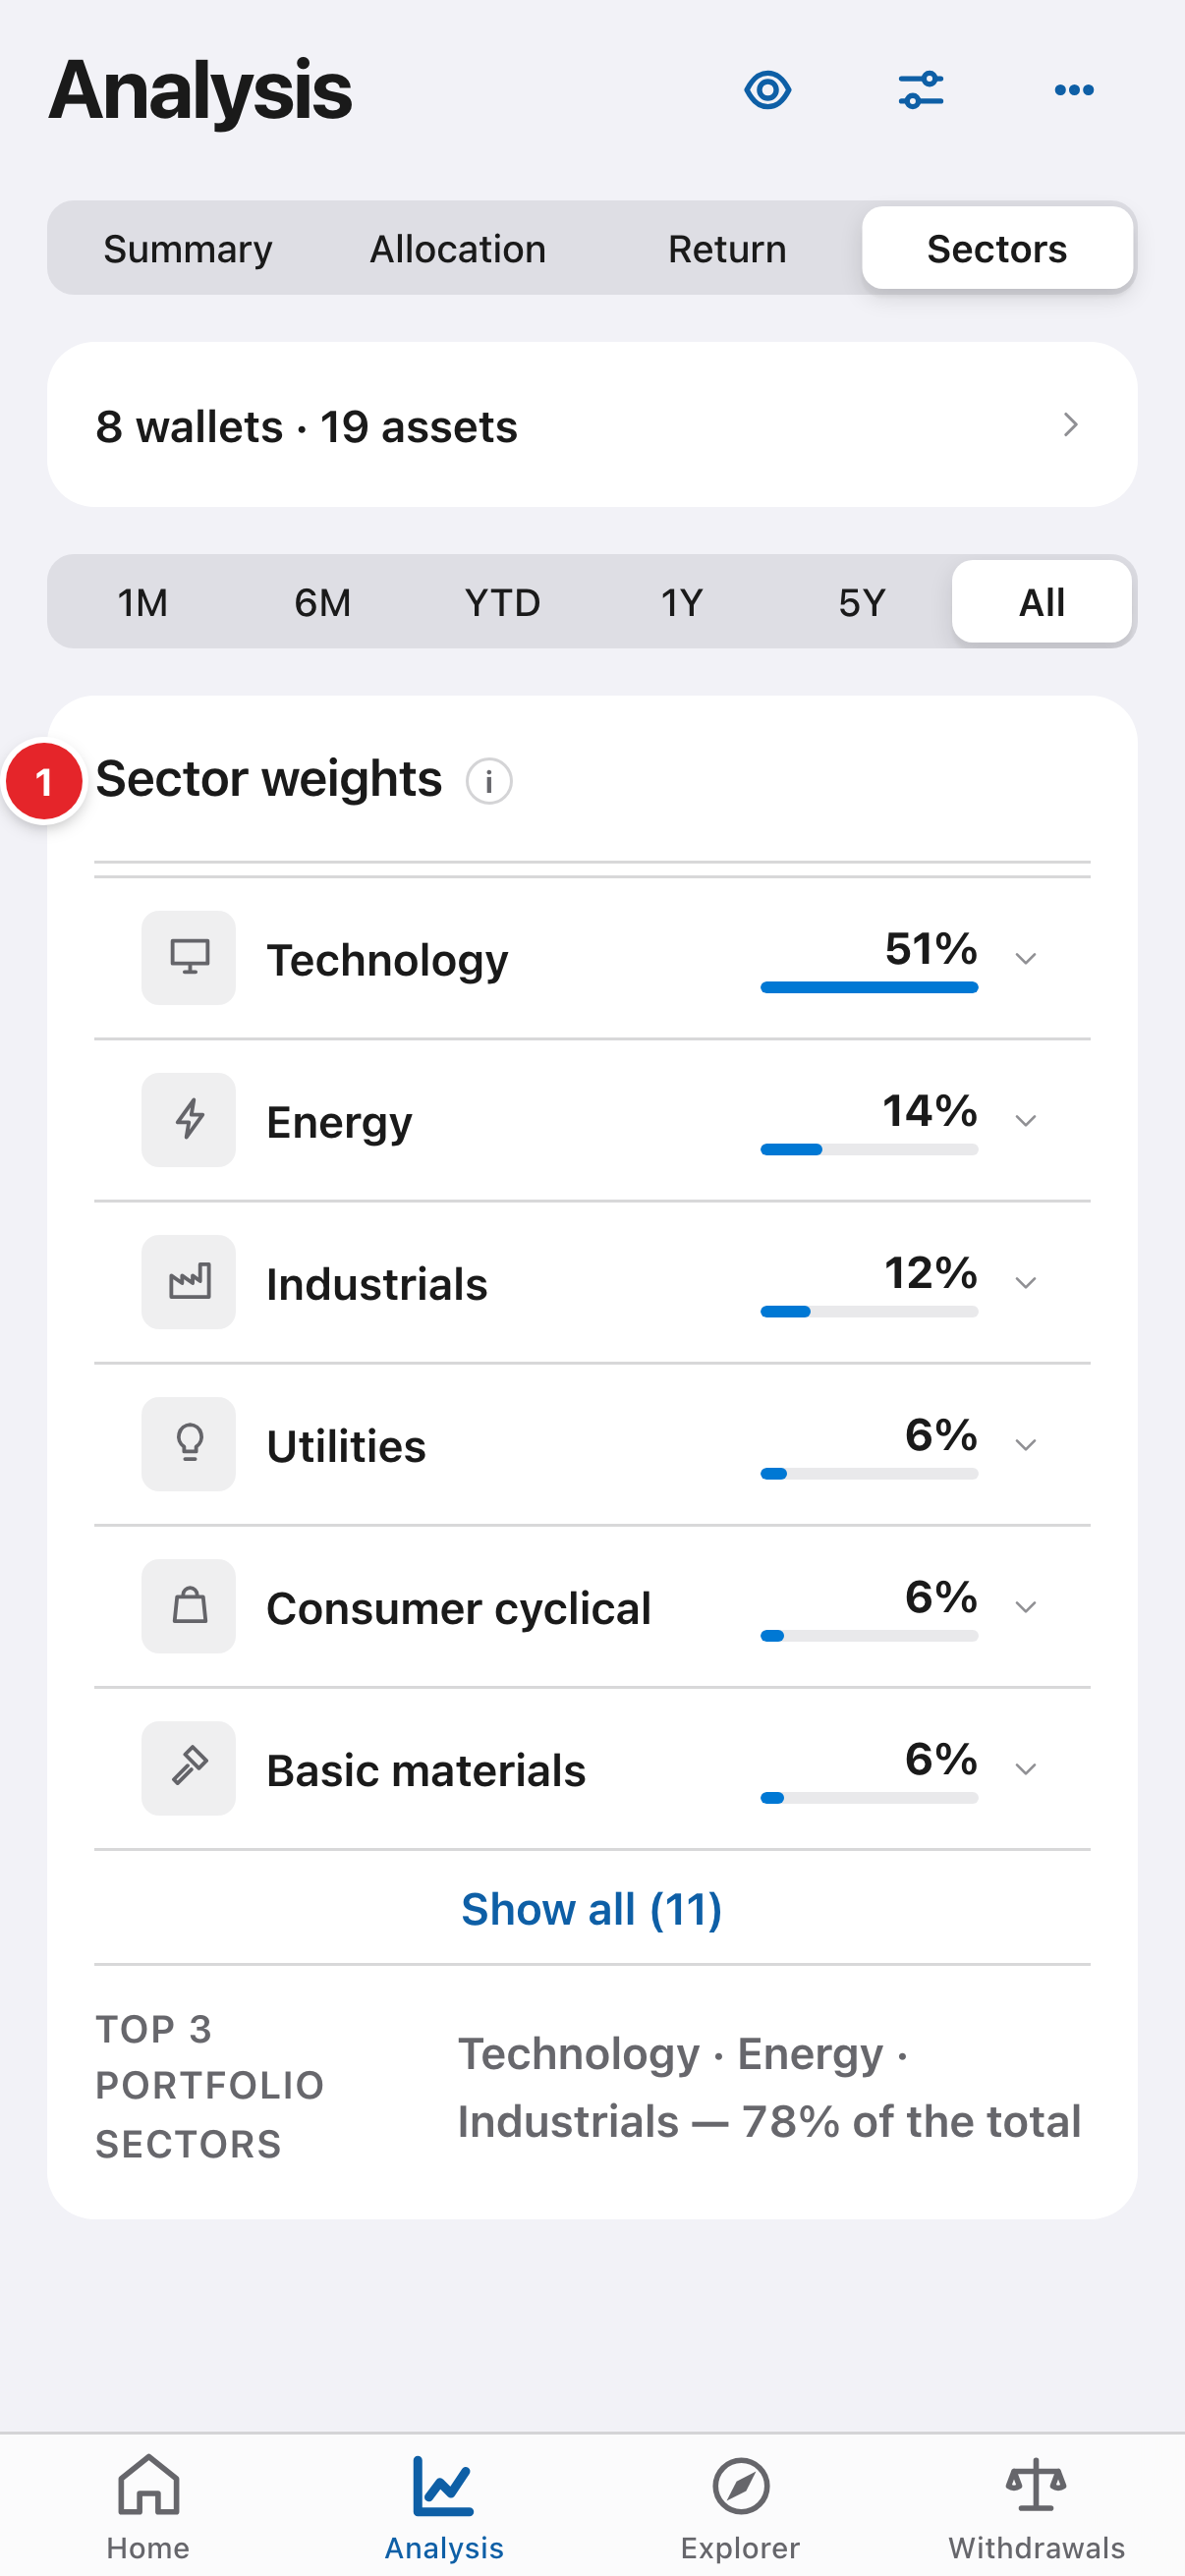
- “Sector weights”: what share of each fund sits in each sector. Two different funds may be buying the same thing; that is why the total per sector is what matters.
Screenshots are of the real app with sample data, not anyone’s own.
Common problems
An asset doesn’t appear in the matrix
The price source doesn’t publish its breakdown. You can assign a sector by hand from its pencil → “Sector”.