 Solidus
Analysis
Analysis · Summary: how much you have and how much you gained
The “Summary” tab answers one question: how is all my money doing? Here is what each number means.
In short
- Everything depends on the scope (which wallets and assets count) and the chosen period.
- Invested is what you put in; G/L is what the market added.
- If the net-worth line pulls away from the dotted one, you are gaining.
- The tab compares your portfolio with the market.
Before you start
Invested
All the money you put in from your own pocket, fees included. Sales are not subtracted: what you took out by selling counts as gain. It is the base your return is calculated on.
G/L (gain or loss)
What the market added over the period: the difference in value between its two ends, discounting what you added or withdrew along the way.
G/L % − CPI and Annualised − CPI
The same gain, after inflation. If it falls below the plain one, part of what you gained is just that the older money was worth more. Turn it on under Settings → “Show inflation data”.
1Narrow down what you look at
At the top you pick the scope —which wallets and assets count; anything switched off stops counting— and the period (1M, 6M, YTD, 1Y, 5Y, All). On iPhone, the scope is the “8 wallets · 19 assets” row.
Below are the key figures: current value, invested, gain, gain %, and annualised return.
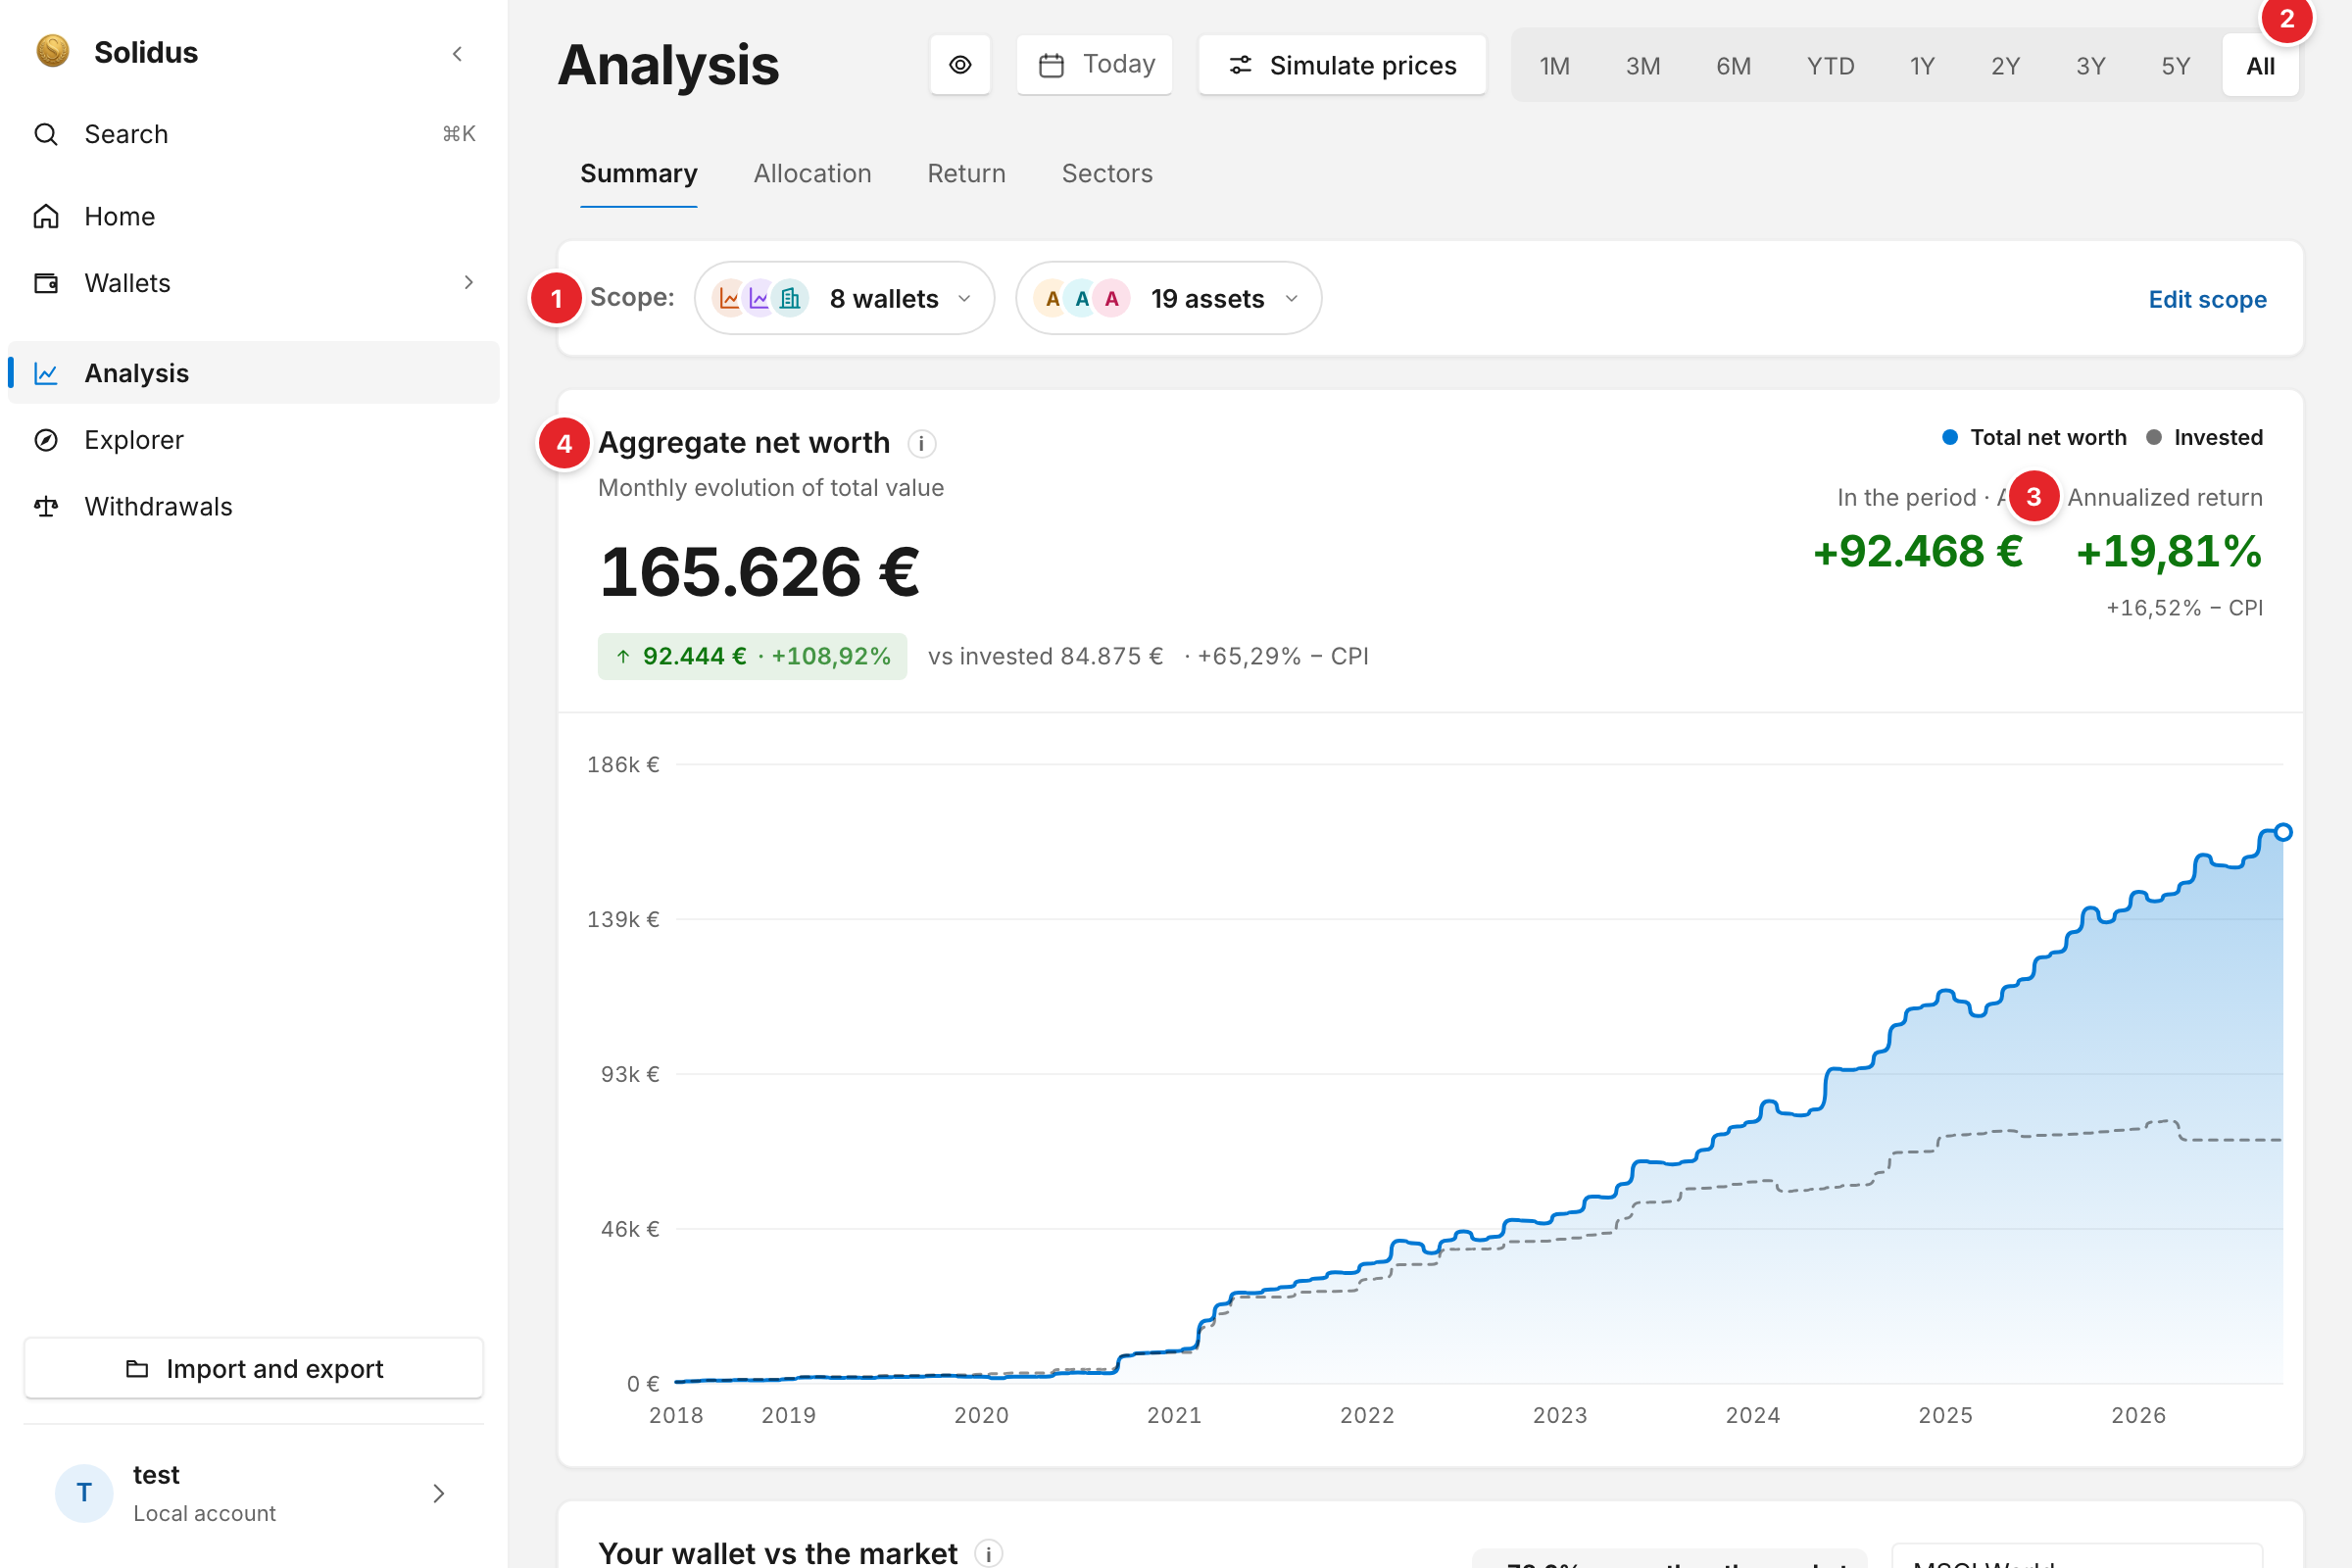
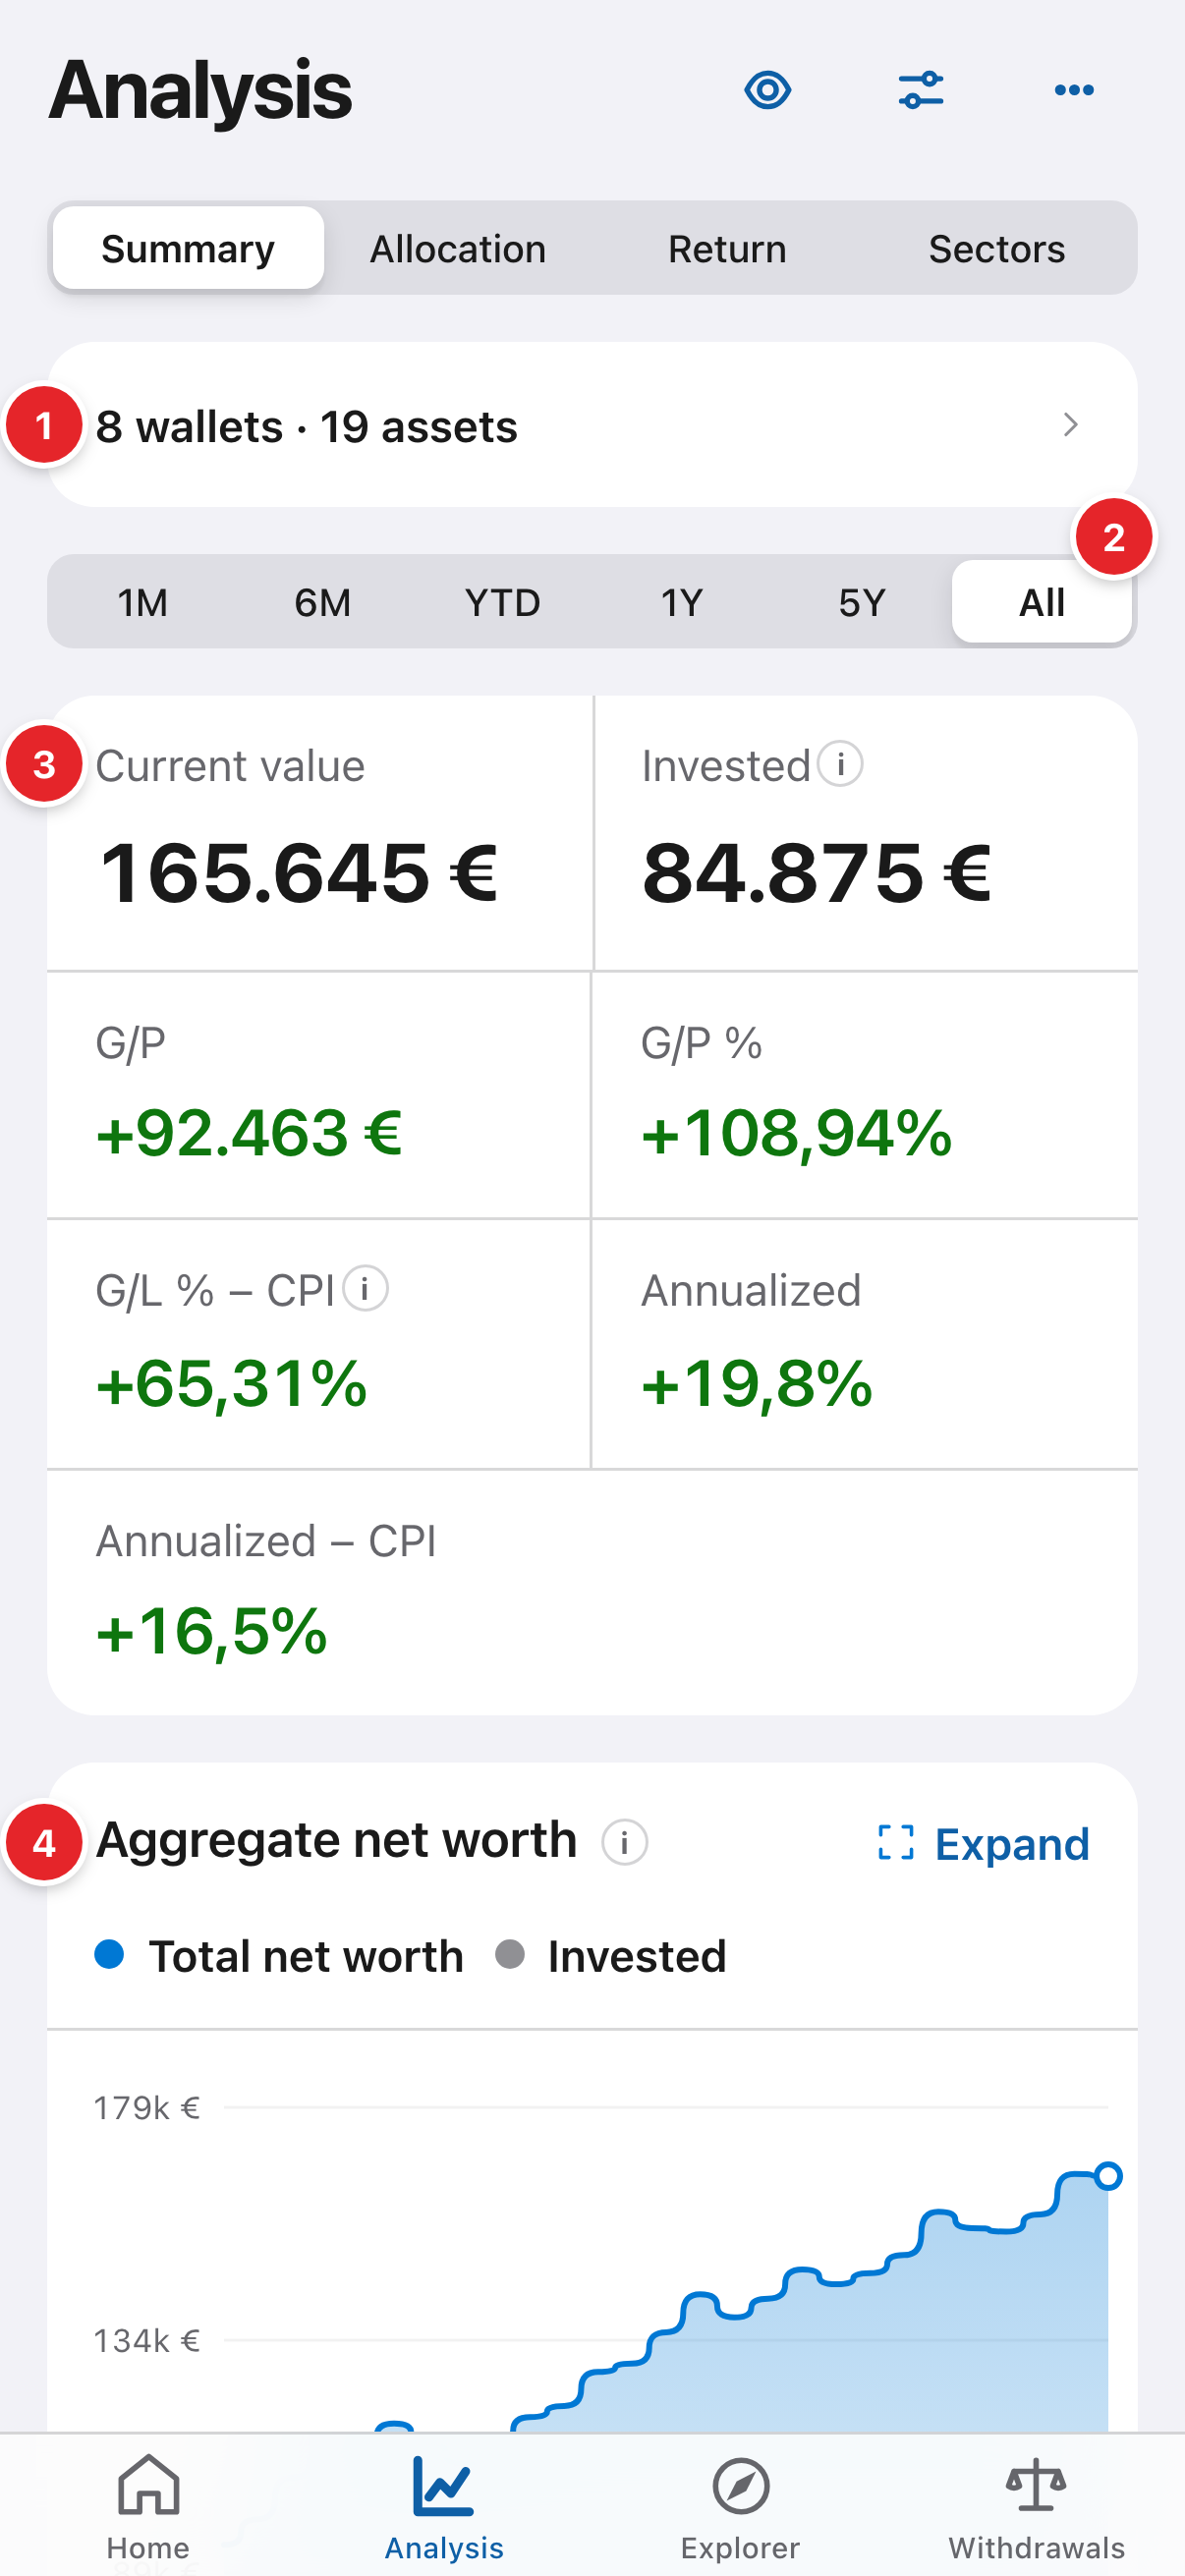
- The scope: which wallets and assets count in every chart. Handy to view one wallet alone or what would happen without your biggest position.
- The period: “All” since your first purchase, or the last 1, 6 months, 1, 5 years…
- The key figures: current value of everything, amount invested, gain (G/L) and annualised return.
- “Aggregate net worth”: the line is the monthly value of all your wallets; the dotted one is what you contributed. The distance between them is your gain.
2Compare yourself with the market
Further down, “Your portfolio vs the market” puts your growth next to an index such as MSCI World. Both lines start at 0% on the same date, so it compares return, not amounts of money. If your line is below, an index fund would have done better over that period.
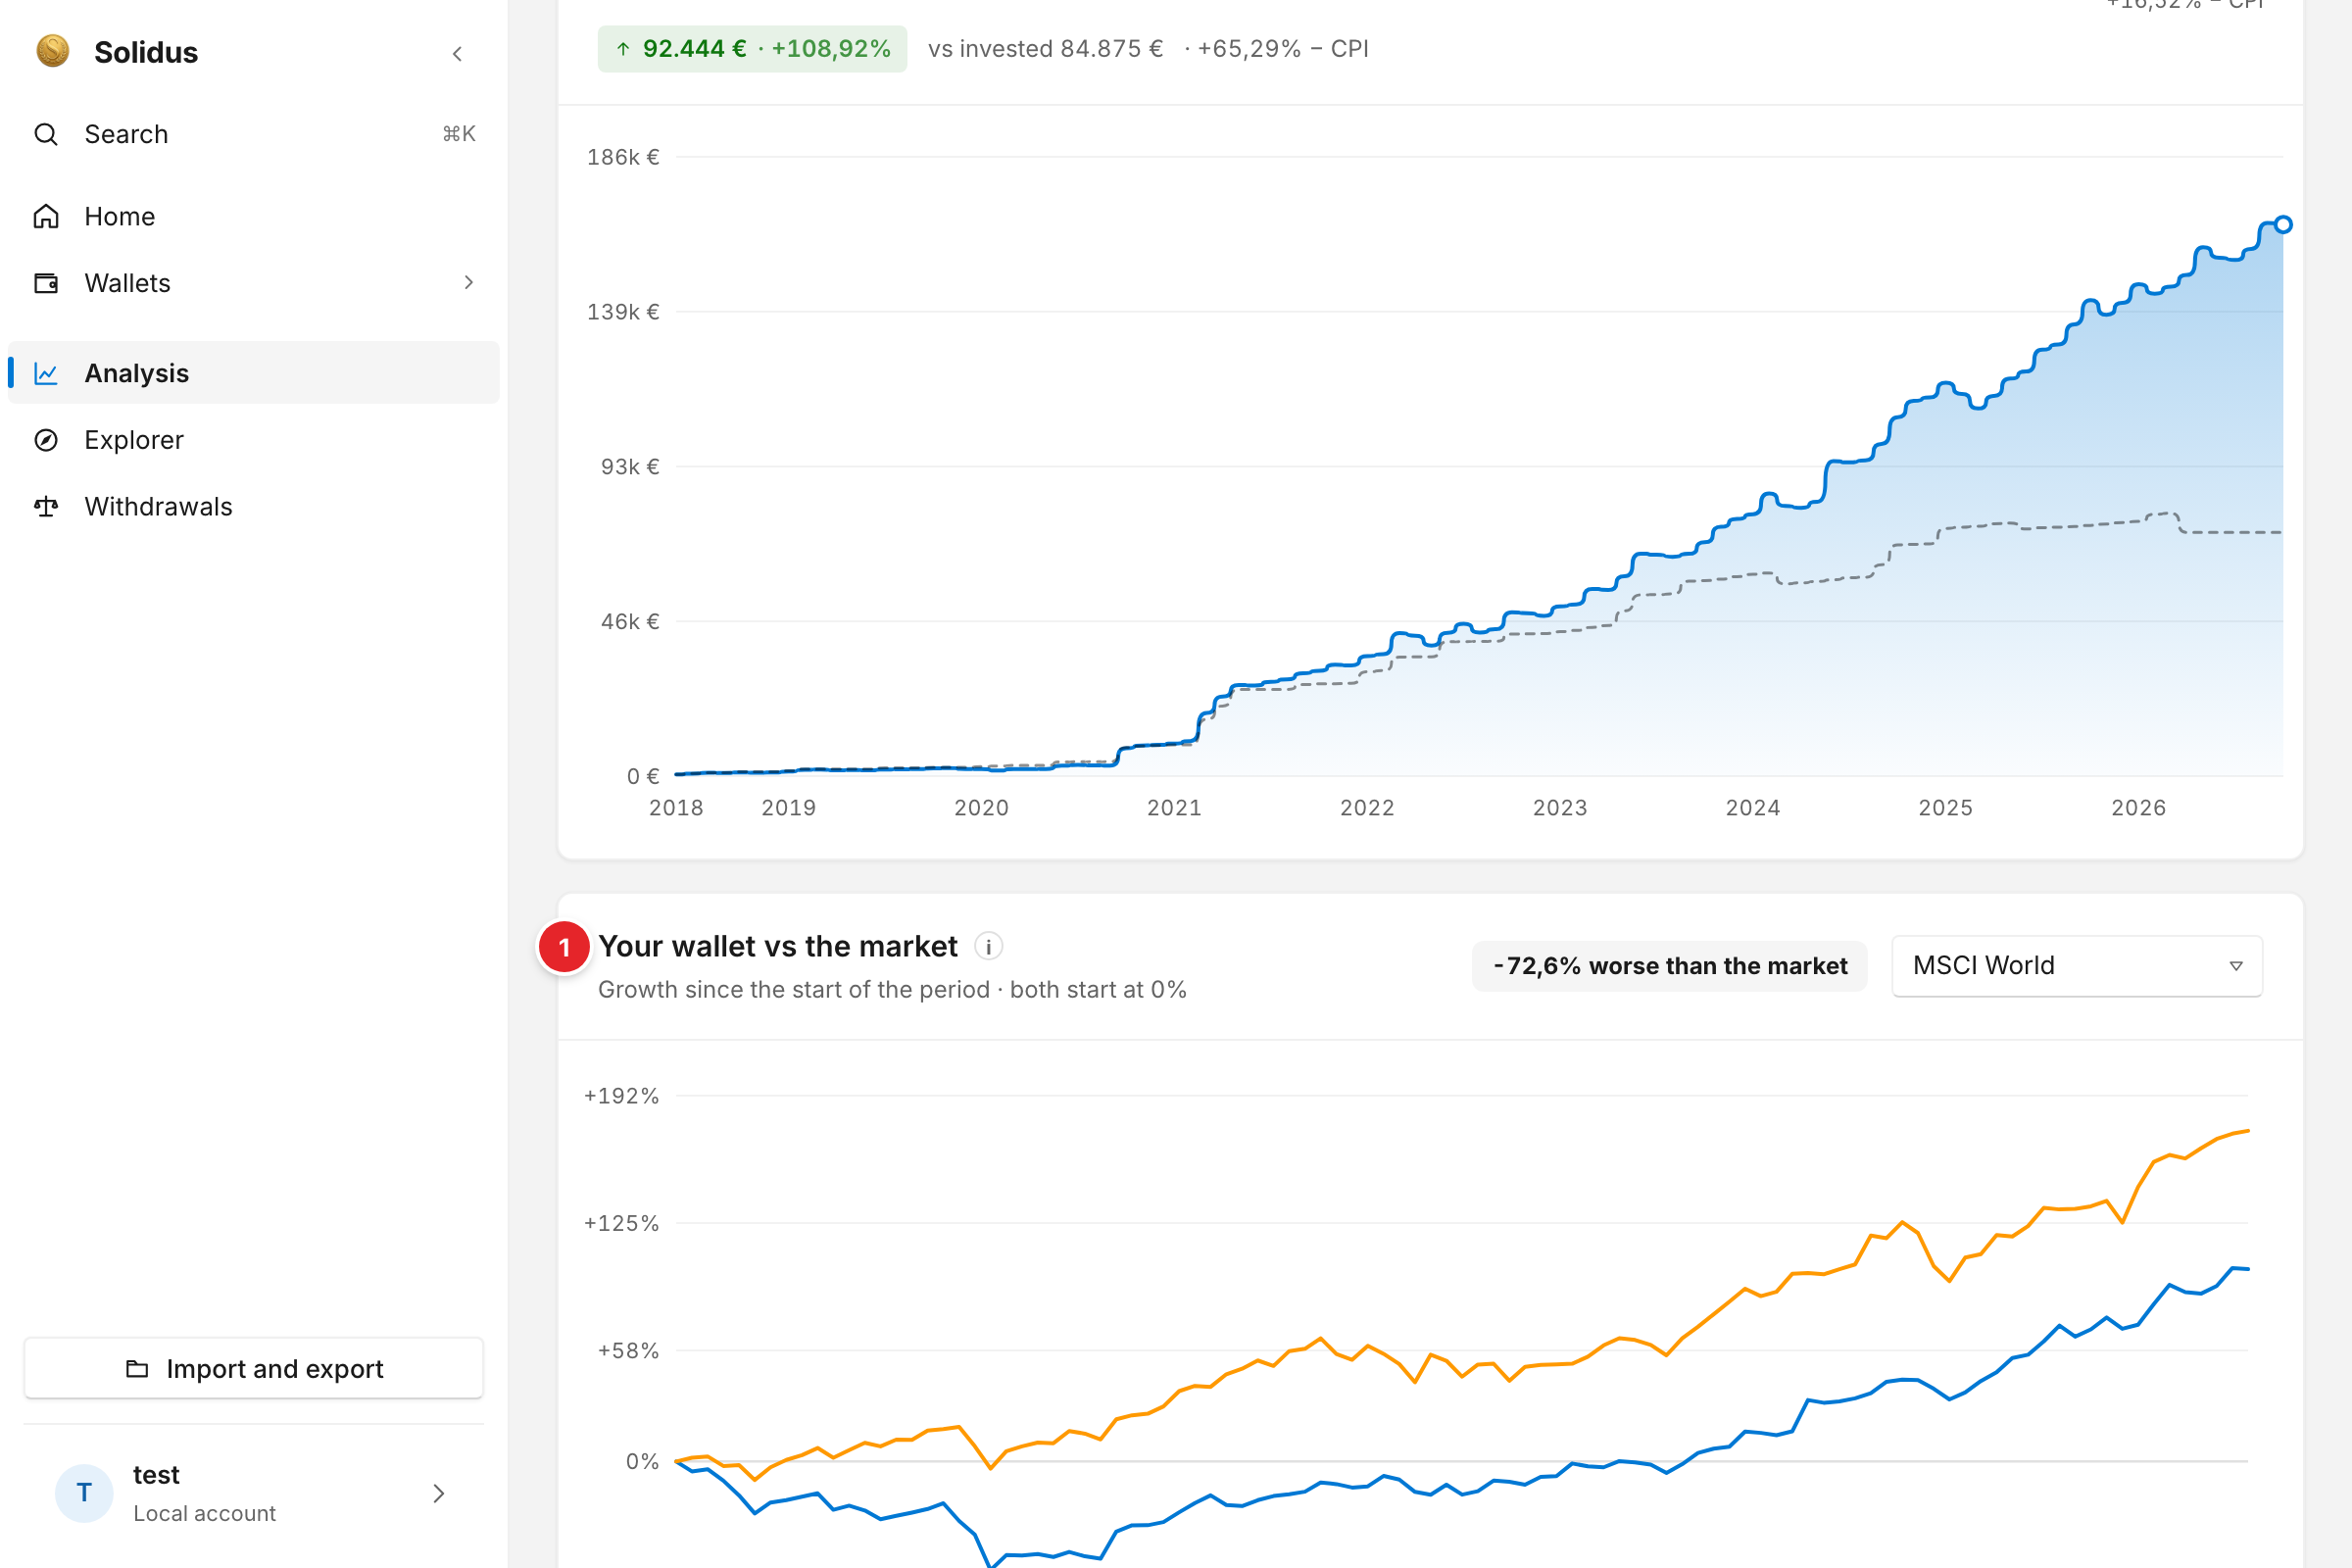
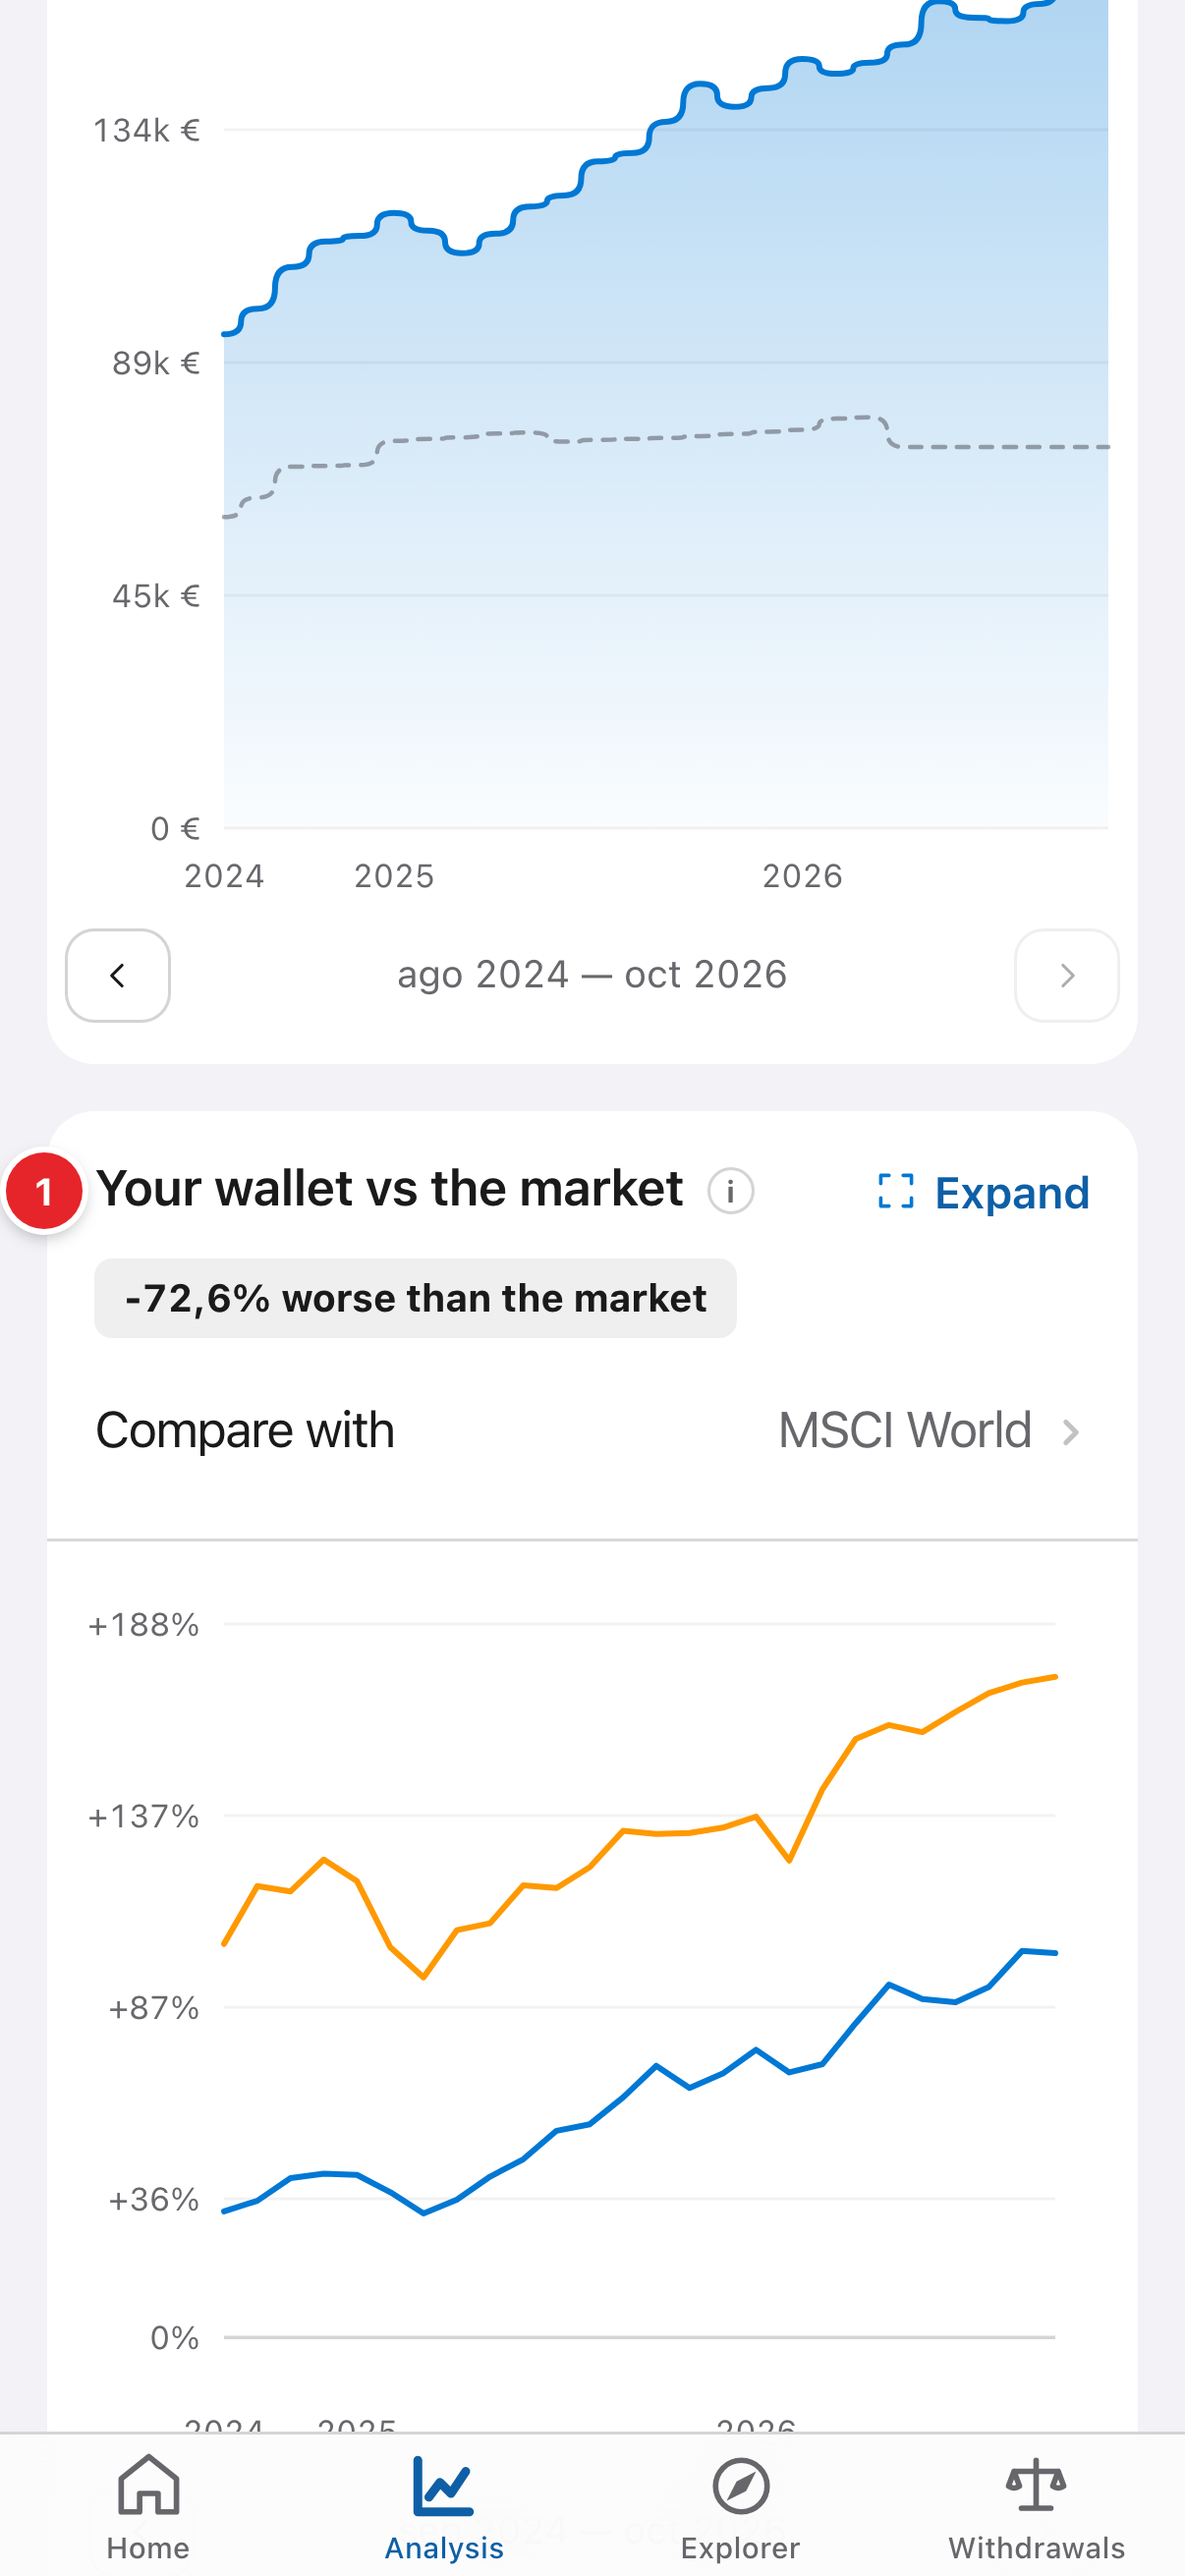
- “Your portfolio vs the market”: your return against an index’s, from the same starting date.
Screenshots are of the real app with sample data, not anyone’s own.
Common problems
Why doesn’t “Invested” go down when I sell?
Because what you take out by selling counts as gain or recovery, not as a contribution you didn’t make. The dotted line on the chart is the net contributed month by month.
My figures change when I change the period
That’s expected: G/L and contributions are calculated for the chosen period. “All” is the full picture.